|
Download Data (XLS File) |
|
||||||||
|
||||||||
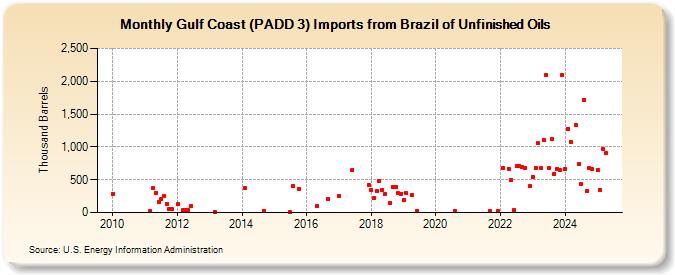
| Gulf Coast (PADD 3) Imports from Brazil of Unfinished Oils (Thousand Barrels) | ||||||||
| Year | Jan | Feb | Mar | Apr | May | Jun | Jul | Aug | Sep | Oct | Nov | Dec |
|---|---|---|---|---|---|---|---|---|---|---|---|---|
| 2010 | 289 | |||||||||||
| 2011 | 25 | 369 | 301 | 161 | 206 | 258 | 136 | 50 | 50 | |||
| 2012 | 123 | 32 | 36 | 33 | 106 | |||||||
| 2013 | 15 | |||||||||||
| 2014 | 377 | 30 | ||||||||||
| 2015 | 3 | 410 | 366 | |||||||||
| 2016 | 96 | 200 | ||||||||||
| 2017 | 245 | 652 | 425 | |||||||||
| 2018 | 336 | 228 | 333 | 485 | 346 | 286 | 150 | 383 | 387 | 294 | 287 | |
| 2019 | 188 | 295 | 270 | 30 | ||||||||
| 2020 | 23 | |||||||||||
| 2021 | 27 | 30 | ||||||||||
| 2022 | 679 | 667 | 502 | 32 | 703 | 703 | 693 | 685 | 401 | |||
| 2023 | 543 | 685 | 1,055 | 673 | 1,111 | 2,098 | 678 | 1,118 | 592 | 664 | 650 | 2,094 |
| 2024 | 667 | |||||||||||
| - = No Data Reported; -- = Not Applicable; NA = Not Available; W = Withheld to avoid disclosure of individual company data. |
| Release Date: 3/29/2024 |
| Next Release Date: 4/30/2024 |