|
Download Data (XLS File) |
|
||||||||
|
||||||||
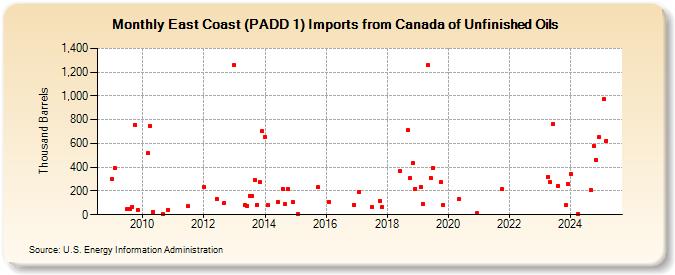
| East Coast (PADD 1) Imports from Canada of Unfinished Oils (Thousand Barrels) | ||||||||
| Year | Jan | Feb | Mar | Apr | May | Jun | Jul | Aug | Sep | Oct | Nov | Dec |
|---|---|---|---|---|---|---|---|---|---|---|---|---|
| 2009 | 299 | 390 | 44 | 45 | 65 | 759 | 40 | |||||
| 2010 | 517 | 749 | 25 | 2 | 43 | |||||||
| 2011 | 71 | |||||||||||
| 2012 | 235 | 135 | 100 | |||||||||
| 2013 | 1,257 | 79 | 76 | 160 | 161 | 292 | 84 | 275 | 701 | |||
| 2014 | 657 | 82 | 110 | 220 | 86 | 220 | 104 | |||||
| 2015 | 5 | 230 | ||||||||||
| 2016 | 108 | 85 | ||||||||||
| 2017 | 194 | 67 | 119 | 63 | ||||||||
| 2018 | 364 | 713 | 310 | 432 | 219 | |||||||
| 2019 | 233 | 91 | 1,257 | 313 | 391 | 272 | 83 | |||||
| 2020 | 130 | 12 | ||||||||||
| 2021 | 214 | |||||||||||
| 2023 | 321 | 274 | 762 | 245 | 78 | 326 | ||||||
| 2024 | 342 | |||||||||||
| - = No Data Reported; -- = Not Applicable; NA = Not Available; W = Withheld to avoid disclosure of individual company data. |
| Release Date: 3/29/2024 |
| Next Release Date: 4/30/2024 |