|
Download Data (XLS File) |
|
||||||||
|
||||||||
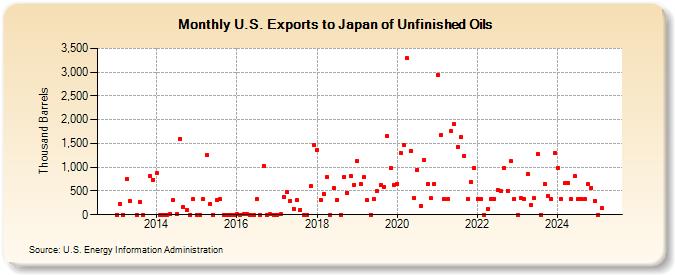
| U.S. Exports to Japan of Unfinished Oils (Thousand Barrels) | ||||||||
| Year | Jan | Feb | Mar | Apr | May | Jun | Jul | Aug | Sep | Oct | Nov | Dec |
|---|---|---|---|---|---|---|---|---|---|---|---|---|
| 2013 | 0 | 227 | 0 | 751 | 282 | 0 | 273 | 0 | 817 | 741 | ||
| 2014 | 881 | 3 | 1 | 0 | 11 | 301 | 13 | 1,601 | 155 | 103 | 1 | 324 |
| 2015 | 1 | 4 | 325 | 1,260 | 229 | 3 | 314 | 324 | 1 | 4 | 1 | 2 |
| 2016 | 5 | 2 | 5 | 5 | 4 | 2 | 328 | 4 | 1,032 | 3 | 12 | 1 |
| 2017 | 4 | 5 | 377 | 470 | 296 | 126 | 302 | 102 | 4 | 3 | 596 | 1,462 |
| 2018 | 1,368 | 318 | 443 | 793 | 1 | 560 | 318 | 4 | 786 | 463 | 816 | 632 |
| 2019 | 1,126 | 650 | 788 | 301 | 3 | 326 | 497 | 627 | 590 | 1,647 | 982 | 623 |
| 2020 | 653 | 1,302 | 1,475 | 3,290 | 1,345 | 362 | 948 | 183 | 1,149 | 647 | 345 | 655 |
| 2021 | 2,944 | 1,686 | 332 | 327 | 1,770 | 1,907 | 1,429 | 1,630 | 1,244 | 327 | 690 | 986 |
| 2022 | 332 | 331 | 1 | 117 | 330 | 331 | 525 | 493 | 981 | 506 | 1,121 | 333 |
| 2023 | 2 | 328 | 329 | 855 | 1 | 342 | 661 | 3 | 651 | 403 | 329 | 956 |
| 2024 | 991 | |||||||||||
| - = No Data Reported; -- = Not Applicable; NA = Not Available; W = Withheld to avoid disclosure of individual company data. |
| Release Date: 3/29/2024 |
| Next Release Date: 4/30/2024 |