|
Download Data (XLS File) |
|
||||||||
|
||||||||
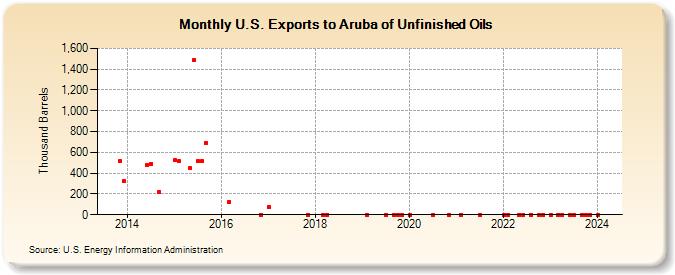
| U.S. Exports to Aruba of Unfinished Oils (Thousand Barrels) | ||||||||
| Year | Jan | Feb | Mar | Apr | May | Jun | Jul | Aug | Sep | Oct | Nov | Dec |
|---|---|---|---|---|---|---|---|---|---|---|---|---|
| 2013 | 515 | 320 | ||||||||||
| 2014 | 480 | 491 | 219 | |||||||||
| 2015 | 523 | 514 | 449 | 1,488 | 516 | 516 | 691 | |||||
| 2016 | 125 | 0 | ||||||||||
| 2017 | 73 | 0 | ||||||||||
| 2018 | 0 | 0 | ||||||||||
| 2019 | 0 | 0 | 0 | 0 | 0 | |||||||
| 2020 | 0 | 0 | 0 | |||||||||
| 2021 | 0 | 0 | ||||||||||
| 2022 | 0 | 0 | 0 | 0 | 0 | 0 | 0 | |||||
| 2023 | 0 | 0 | 0 | 0 | 0 | 0 | 0 | 0 | ||||
| 2024 | 0 | |||||||||||
| - = No Data Reported; -- = Not Applicable; NA = Not Available; W = Withheld to avoid disclosure of individual company data. |
| Release Date: 8/30/2024 |
| Next Release Date: 9/30/2024 |