|
Download Data (XLS File) |
|
||||||||
|
||||||||
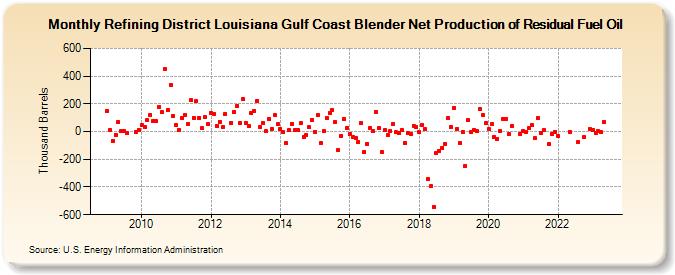
| Refining District Louisiana Gulf Coast Blender Net Production of Residual Fuel Oil (Thousand Barrels) | ||||||||
| Year | Jan | Feb | Mar | Apr | May | Jun | Jul | Aug | Sep | Oct | Nov | Dec |
|---|---|---|---|---|---|---|---|---|---|---|---|---|
| 2009 | 149 | 8 | -67 | -22 | 70 | 1 | 1 | -11 | -1 | 14 | ||
| 2010 | 44 | 36 | 82 | 118 | 74 | 74 | 178 | 139 | 449 | 155 | 336 | 115 |
| 2011 | 44 | 13 | 99 | 122 | 53 | 225 | 100 | 217 | 100 | 23 | 102 | 52 |
| 2012 | 134 | 127 | 43 | 71 | 31 | 126 | 64 | 143 | 187 | 64 | 234 | |
| 2013 | 62 | 38 | 131 | 151 | 223 | 31 | 62 | 3 | 93 | 17 | 117 | 52 |
| 2014 | 18 | 0 | -86 | 9 | 57 | 8 | 8 | 59 | -40 | -25 | 30 | 84 |
| 2015 | -1 | 121 | -84 | 1 | 98 | 135 | 156 | 70 | -135 | -32 | 90 | 28 |
| 2016 | -17 | -36 | -48 | -77 | 60 | -147 | -88 | 26 | 2 | 144 | 23 | -147 |
| 2017 | 11 | -28 | 1 | 55 | -6 | -12 | 12 | -84 | -13 | -21 | 42 | 31 |
| 2018 | -2 | 49 | 15 | -344 | -395 | -544 | -154 | -138 | -117 | -89 | 97 | 36 |
| 2019 | 173 | 20 | -84 | -5 | -249 | 82 | -6 | 14 | 2 | 163 | 121 | 61 |
| 2020 | 20 | 51 | -40 | -53 | 4 | 91 | 93 | -21 | 42 | -20 | ||
| 2021 | 1 | -3 | 23 | 44 | -49 | 96 | -8 | 9 | -93 | -15 | -1 | |
| 2022 | -29 | 0 | -72 | -41 | 17 | |||||||
| 2023 | 14 | -9 | 1 | -5 | 72 | |||||||
| 2024 | 96 | |||||||||||
| - = No Data Reported; -- = Not Applicable; NA = Not Available; W = Withheld to avoid disclosure of individual company data. |
| Release Date: 8/30/2024 |
| Next Release Date: 9/30/2024 |