|
Download Data (XLS File) |
|
||||||||
|
||||||||
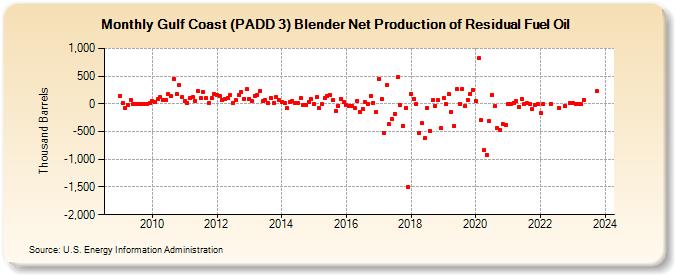
| Gulf Coast (PADD 3) Blender Net Production of Residual Fuel Oil (Thousand Barrels) | ||||||||
| Year | Jan | Feb | Mar | Apr | May | Jun | Jul | Aug | Sep | Oct | Nov | Dec |
|---|---|---|---|---|---|---|---|---|---|---|---|---|
| 2009 | 149 | 8 | -67 | -22 | 71 | 1 | 1 | -11 | 0 | 0 | -1 | 14 |
| 2010 | 44 | 36 | 82 | 118 | 74 | 74 | 178 | 139 | 449 | 174 | 336 | 115 |
| 2011 | 44 | 13 | 99 | 122 | 53 | 225 | 100 | 217 | 100 | 23 | 102 | 176 |
| 2012 | 154 | 143 | 66 | 84 | 106 | 152 | 8 | 69 | 152 | 209 | 93 | 261 |
| 2013 | 94 | 44 | 143 | 167 | 227 | 43 | 72 | 7 | 103 | 21 | 125 | 62 |
| 2014 | 42 | 8 | -76 | 31 | 59 | 18 | 12 | 104 | -19 | -19 | 31 | 85 |
| 2015 | 0 | 121 | -84 | 1 | 98 | 135 | 156 | 70 | -135 | -32 | 90 | 28 |
| 2016 | -17 | -36 | -48 | -77 | 60 | -147 | -88 | 26 | 2 | 144 | 23 | -147 |
| 2017 | 456 | 84 | -518 | 344 | -372 | -276 | -178 | 476 | -29 | -403 | -74 | -1,504 |
| 2018 | 177 | 92 | -11 | -521 | -352 | -621 | -68 | -487 | 61 | -34 | 61 | -442 |
| 2019 | 105 | -10 | 175 | -151 | -391 | 266 | 5 | 271 | -46 | 71 | 185 | 248 |
| 2020 | 52 | 818 | -293 | -841 | -914 | -316 | 158 | -46 | -435 | -465 | -363 | -385 |
| 2021 | 1 | -3 | 23 | 44 | -49 | 96 | -8 | 9 | 0 | -93 | -15 | -1 |
| 2022 | -162 | 0 | 0 | -72 | -41 | 17 | ||||||
| 2023 | 14 | -9 | 1 | -5 | 72 | 229 | ||||||
| 2024 | 70 | -6 | 25 | |||||||||
| - = No Data Reported; -- = Not Applicable; NA = Not Available; W = Withheld to avoid disclosure of individual company data. |
| Release Date: 8/30/2024 |
| Next Release Date: 9/30/2024 |
Referring Pages: