|
Download Data (XLS File) |
|
||||||||
|
||||||||
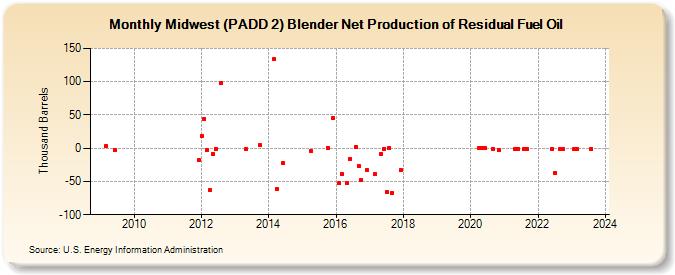
| Midwest (PADD 2) Blender Net Production of Residual Fuel Oil (Thousand Barrels) | ||||||||
| Year | Jan | Feb | Mar | Apr | May | Jun | Jul | Aug | Sep | Oct | Nov | Dec |
|---|---|---|---|---|---|---|---|---|---|---|---|---|
| 2009 | 3 | -2 | ||||||||||
| 2011 | -18 | |||||||||||
| 2012 | 19 | 44 | -3 | -63 | -9 | -1 | 98 | |||||
| 2013 | -1 | 5 | ||||||||||
| 2014 | 134 | -61 | -22 | |||||||||
| 2015 | -4 | 1 | 46 | |||||||||
| 2016 | -53 | -39 | -52 | -16 | 2 | -27 | -48 | -33 | ||||
| 2017 | -39 | -8 | -1 | -66 | 0 | -67 | -33 | |||||
| 2020 | 0 | 0 | 0 | -1 | -2 | |||||||
| 2021 | -1 | -1 | -1 | -1 | ||||||||
| 2022 | -1 | -37 | -1 | -1 | ||||||||
| 2023 | -1 | -1 | -1 | |||||||||
| 2024 | -1 | -1 | ||||||||||
| - = No Data Reported; -- = Not Applicable; NA = Not Available; W = Withheld to avoid disclosure of individual company data. |
| Release Date: 8/30/2024 |
| Next Release Date: 9/30/2024 |
Referring Pages: