|
Download Data (XLS File) |
|
||||||||
|
||||||||
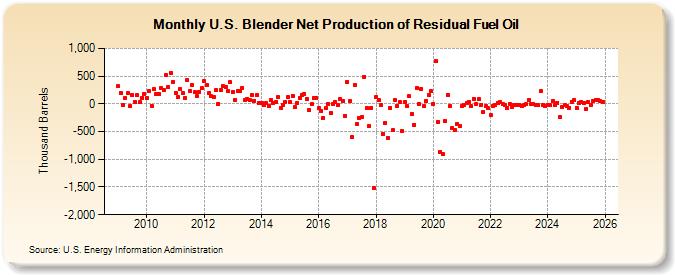
| U.S. Blender Net Production of Residual Fuel Oil (Thousand Barrels) | ||||||||
| Year | Jan | Feb | Mar | Apr | May | Jun | Jul | Aug | Sep | Oct | Nov | Dec |
|---|---|---|---|---|---|---|---|---|---|---|---|---|
| 2009 | 313 | 200 | -20 | 100 | 188 | -38 | 158 | 40 | 151 | 27 | 113 | 178 |
| 2010 | 107 | 224 | -31 | 259 | 180 | 170 | 279 | 241 | 514 | 302 | 561 | 395 |
| 2011 | 196 | 123 | 263 | 190 | 106 | 423 | 230 | 340 | 206 | 135 | 214 | 277 |
| 2012 | 405 | 335 | 191 | 136 | 132 | 241 | 2 | 256 | 316 | 306 | 231 | 387 |
| 2013 | 216 | 66 | 228 | 230 | 291 | 76 | 93 | 62 | 158 | 57 | 157 | 16 |
| 2014 | 10 | -25 | 23 | -43 | 67 | 9 | 35 | 115 | -74 | -14 | 35 | 122 |
| 2015 | 31 | 150 | -64 | 11 | 112 | 155 | 182 | 86 | -119 | -10 | 108 | 103 |
| 2016 | -80 | -123 | -248 | -76 | -1 | -161 | 5 | 32 | -24 | 79 | 59 | -213 |
| 2017 | 399 | 46 | -599 | 343 | -371 | -262 | -243 | 491 | -81 | -402 | -67 | -1,522 |
| 2018 | 123 | 72 | -27 | -544 | -340 | -610 | -71 | -478 | 62 | -35 | 27 | -489 |
| 2019 | 36 | -40 | 135 | -175 | -375 | 290 | 1 | 267 | -42 | 56 | 158 | 223 |
| 2020 | 4 | 774 | -319 | -870 | -910 | -311 | 161 | -41 | -440 | -467 | -369 | -408 |
| 2021 | -35 | -22 | 16 | 33 | -48 | 94 | -3 | 80 | -21 | -145 | -41 | -80 |
| 2022 | -208 | -33 | -29 | 12 | 26 | -1 | -30 | -75 | -3 | -49 | -18 | -20 |
| 2023 | -15 | -37 | -29 | -12 | 72 | -1 | 0 | -17 | -18 | 229 | -28 | -43 |
| 2024 | -13 | |||||||||||
| - = No Data Reported; -- = Not Applicable; NA = Not Available; W = Withheld to avoid disclosure of individual company data. |
| Release Date: 3/29/2024 |
| Next Release Date: 4/30/2024 |
Referring Pages: