|
Download Data (XLS File) |
|
||||||||
|
||||||||
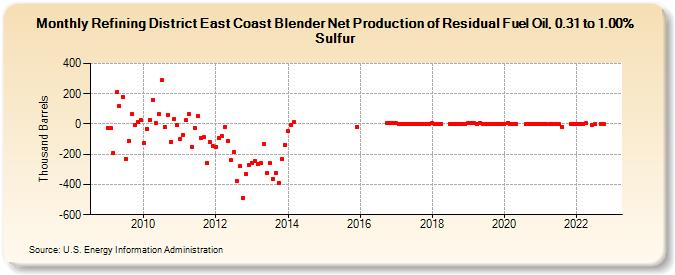
| Refining District East Coast Blender Net Production of Residual Fuel Oil, 0.31 to 1.00% Sulfur (Thousand Barrels) | ||||||||
| Year | Jan | Feb | Mar | Apr | May | Jun | Jul | Aug | Sep | Oct | Nov | Dec |
|---|---|---|---|---|---|---|---|---|---|---|---|---|
| 2009 | -24 | -29 | -189 | 209 | 120 | 178 | -231 | -111 | 64 | -5 | 14 | 29 |
| 2010 | -127 | -33 | 28 | 161 | 7 | 63 | 291 | -21 | 62 | -119 | 30 | -7 |
| 2011 | -101 | -70 | 23 | 64 | -151 | -28 | 54 | -91 | -89 | -260 | -117 | -146 |
| 2012 | -150 | -93 | -77 | -19 | -110 | -240 | -184 | -376 | -280 | -487 | -331 | -269 |
| 2013 | -258 | -246 | -262 | -260 | -131 | -325 | -260 | -362 | -324 | -388 | -231 | -137 |
| 2014 | -49 | -5 | 13 | |||||||||
| 2015 | -17 | |||||||||||
| 2016 | 4 | 4 | 4 | |||||||||
| 2017 | 4 | 2 | 3 | 2 | 2 | 1 | 1 | 1 | 1 | 1 | 1 | 1 |
| 2018 | 7 | 1 | 2 | 3 | 1 | 1 | 1 | 1 | 1 | 1 | ||
| 2019 | 6 | 7 | 4 | 0 | 8 | 3 | 0 | 1 | 1 | 1 | 2 | 3 |
| 2020 | 2 | 8 | 0 | 1 | -1 | 0 | -1 | -1 | -1 | 0 | ||
| 2021 | -1 | 1 | 0 | -2 | 0 | 0 | -3 | -17 | 3 | 1 | ||
| 2022 | 3 | -3 | -1 | 4 | -4 | -2 | 0 | -1 | ||||
| - = No Data Reported; -- = Not Applicable; NA = Not Available; W = Withheld to avoid disclosure of individual company data. |
| Release Date: 8/30/2024 |
| Next Release Date: 9/30/2024 |