|
Download Data (XLS File) |
|
||||||||
|
||||||||
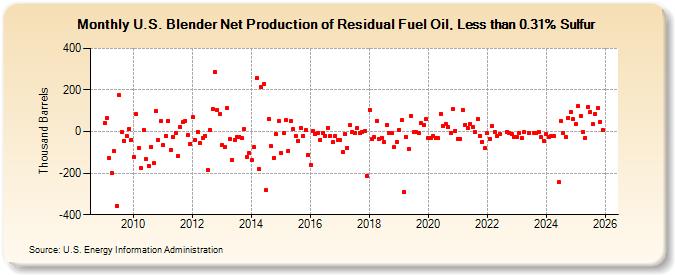
| U.S. Blender Net Production of Residual Fuel Oil, Less than 0.31% Sulfur (Thousand Barrels) | ||||||||
| Year | Jan | Feb | Mar | Apr | May | Jun | Jul | Aug | Sep | Oct | Nov | Dec |
|---|---|---|---|---|---|---|---|---|---|---|---|---|
| 2009 | 39 | 63 | -129 | -200 | -94 | -356 | 174 | -4 | -45 | -21 | 13 | -39 |
| 2010 | -123 | 83 | -77 | -177 | 8 | -133 | -164 | -73 | -152 | 100 | -39 | 49 |
| 2011 | -66 | -19 | 53 | -87 | -24 | -6 | -117 | 22 | 44 | 51 | -17 | -58 |
| 2012 | 68 | -43 | 0 | -56 | -30 | -19 | -184 | 9 | 108 | 288 | 103 | 84 |
| 2013 | -64 | -74 | 113 | -38 | -138 | -39 | -24 | -24 | -33 | 10 | -120 | -101 |
| 2014 | -136 | -76 | 257 | -181 | 214 | 230 | -283 | 61 | -70 | -127 | -12 | 52 |
| 2015 | -103 | -8 | 54 | -92 | 50 | 10 | -21 | -46 | 18 | -21 | 8 | -111 |
| 2016 | -160 | 3 | -14 | -5 | -39 | -5 | -21 | 18 | -21 | -48 | -19 | -40 |
| 2017 | -43 | -100 | -14 | -77 | 30 | -1 | -6 | 19 | -9 | 0 | 1 | -213 |
| 2018 | 106 | -37 | -26 | 52 | -35 | -29 | -51 | 33 | -8 | -9 | -76 | -50 |
| 2019 | 8 | 55 | -290 | -27 | -86 | 76 | -4 | -1 | -5 | 42 | 31 | 59 |
| 2020 | -33 | -31 | -22 | -33 | -33 | 86 | 27 | 38 | 21 | -6 | 108 | 5 |
| 2021 | -35 | -35 | 105 | 33 | 15 | 37 | 23 | -3 | 61 | -20 | -49 | -81 |
| 2022 | -9 | -34 | 27 | -1 | -22 | -10 | 0 | -7 | -14 | -25 | ||
| 2023 | -28 | -5 | -30 | -4 | -5 | -5 | -8 | 0 | -28 | -44 | ||
| 2024 | -13 | -26 | -22 | -21 | ||||||||
| - = No Data Reported; -- = Not Applicable; NA = Not Available; W = Withheld to avoid disclosure of individual company data. |
| Release Date: 8/30/2024 |
| Next Release Date: 9/30/2024 |