|
Download Data (XLS File) |
|
||||||||
|
||||||||
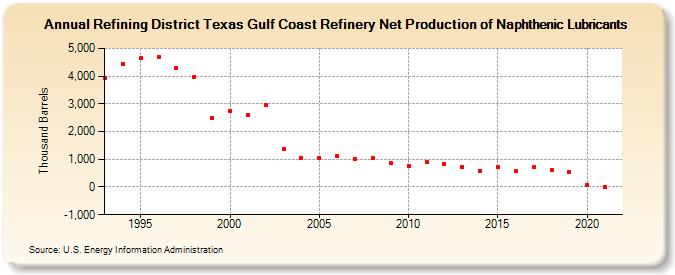
| Refining District Texas Gulf Coast Refinery Net Production of Naphthenic Lubricants (Thousand Barrels) | ||||||||
| Decade | Year-0 | Year-1 | Year-2 | Year-3 | Year-4 | Year-5 | Year-6 | Year-7 | Year-8 | Year-9 |
|---|---|---|---|---|---|---|---|---|---|---|
| 1990's | 3,948 | 4,424 | 4,642 | 4,703 | 4,275 | 3,983 | 2,505 | |||
| 2000's | 2,744 | 2,585 | 2,947 | 1,376 | 1,047 | 1,058 | 1,108 | 1,003 | 1,051 | 851 |
| 2010's | 770 | 915 | 820 | 709 | 577 | 704 | 574 | 709 | 597 | 533 |
| 2020's | 58 | -1 |
| - = No Data Reported; -- = Not Applicable; NA = Not Available; W = Withheld to avoid disclosure of individual company data. |
| Release Date: 8/30/2024 |
| Next Release Date: 8/29/2025 |