|
Download Data (XLS File) |
|
||||||||
|
||||||||
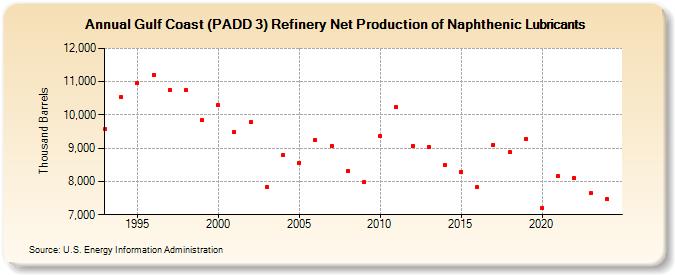
| Gulf Coast (PADD 3) Refinery Net Production of Naphthenic Lubricants (Thousand Barrels) | ||||||||
| Decade | Year-0 | Year-1 | Year-2 | Year-3 | Year-4 | Year-5 | Year-6 | Year-7 | Year-8 | Year-9 |
|---|---|---|---|---|---|---|---|---|---|---|
| 1990's | 9,570 | 10,534 | 10,959 | 11,214 | 10,762 | 10,756 | 9,853 | |||
| 2000's | 10,293 | 9,481 | 9,775 | 7,845 | 8,802 | 8,565 | 9,245 | 9,064 | 8,321 | 7,971 |
| 2010's | 9,373 | 10,236 | 9,062 | 9,050 | 8,492 | 8,297 | 7,824 | 9,099 | 8,872 | 9,288 |
| 2020's | 7,216 | 8,155 | 8,102 | 7,645 | 7,460 |
| - = No Data Reported; -- = Not Applicable; NA = Not Available; W = Withheld to avoid disclosure of individual company data. |
| Release Date: 6/30/2025 |
| Next Release Date: 8/29/2025 |