|
Download Data (XLS File) |
|
||||||||
|
||||||||
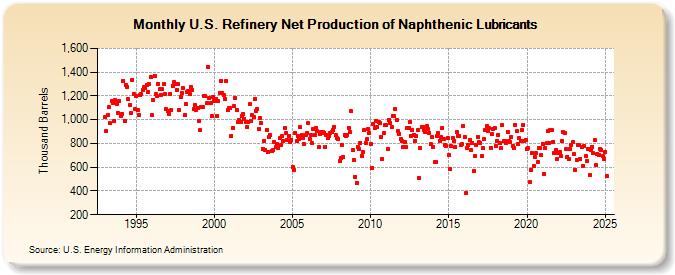
| U.S. Refinery Net Production of Naphthenic Lubricants (Thousand Barrels) | ||||||||
| Year | Jan | Feb | Mar | Apr | May | Jun | Jul | Aug | Sep | Oct | Nov | Dec |
|---|---|---|---|---|---|---|---|---|---|---|---|---|
| 1993 | 1,022 | 904 | 1,040 | 1,103 | 968 | 1,154 | 1,141 | 993 | 1,163 | 1,130 | 1,056 | 1,156 |
| 1994 | 1,027 | 1,051 | 1,328 | 990 | 1,296 | 1,279 | 1,172 | 1,124 | 1,055 | 1,333 | 1,214 | 1,090 |
| 1995 | 1,201 | 1,081 | 1,040 | 1,208 | 1,214 | 1,250 | 1,274 | 1,269 | 1,291 | 1,237 | 1,301 | 1,362 |
| 1996 | 1,036 | 1,168 | 1,368 | 1,213 | 1,196 | 1,301 | 1,255 | 1,209 | 1,255 | 1,301 | 1,216 | 1,087 |
| 1997 | 1,075 | 1,051 | 1,216 | 1,082 | 1,286 | 1,315 | 1,301 | 1,253 | 1,302 | 1,083 | 1,193 | 1,227 |
| 1998 | 1,264 | 1,037 | 1,133 | 1,233 | 1,239 | 1,213 | 1,277 | 1,251 | 1,088 | 1,120 | 1,082 | 1,102 |
| 1999 | 990 | 912 | 1,103 | 1,103 | 1,198 | 1,196 | 1,137 | 1,447 | 1,185 | 1,137 | 1,031 | 1,189 |
| 2000 | 1,161 | 1,177 | 1,035 | 1,157 | 1,227 | 1,326 | 1,225 | 1,209 | 1,177 | 1,328 | 1,081 | 1,096 |
| 2001 | 1,096 | 866 | 930 | 1,111 | 1,184 | 1,082 | 977 | 999 | 977 | 1,031 | 1,050 | 1,009 |
| 2002 | 983 | 936 | 981 | 1,128 | 992 | 1,039 | 1,020 | 1,176 | 1,072 | 1,089 | 924 | 1,016 |
| 2003 | 974 | 756 | 822 | 745 | 913 | 730 | 853 | 868 | 737 | 742 | 811 | 766 |
| 2004 | 794 | 762 | 844 | 785 | 859 | 824 | 931 | 888 | 826 | 865 | 813 | 831 |
| 2005 | 603 | 580 | 886 | 819 | 866 | 841 | 935 | 871 | 847 | 794 | 870 | 890 |
| 2006 | 968 | 839 | 869 | 801 | 924 | 875 | 926 | 901 | 768 | 881 | 900 | 894 |
| 2007 | 888 | 773 | 873 | 843 | 863 | 888 | 894 | 917 | 939 | 868 | 846 | 834 |
| 2008 | 648 | 679 | 790 | 685 | 869 | 863 | 875 | 931 | 894 | 1,070 | 743 | 661 |
| 2009 | 521 | 465 | 772 | 755 | 806 | 698 | 731 | 914 | 805 | 834 | 925 | 886 |
| 2010 | 796 | 596 | 962 | 933 | 988 | 940 | 978 | 976 | 850 | 670 | 884 | 953 |
| 2011 | 955 | 752 | 1,000 | 975 | 935 | 1,034 | 1,028 | 1,087 | 999 | 902 | 879 | 834 |
| 2012 | 817 | 769 | 810 | 766 | 927 | 933 | 982 | 865 | 912 | 874 | 822 | 863 |
| 2013 | 912 | 512 | 762 | 940 | 942 | 914 | 895 | 950 | 918 | 892 | 793 | 852 |
| 2014 | 767 | 641 | 645 | 865 | 886 | 821 | 853 | 932 | 840 | 785 | 780 | 848 |
| 2015 | 699 | 582 | 776 | 847 | 821 | 769 | 895 | 865 | 865 | 784 | 794 | 950 |
| 2016 | 854 | 379 | 762 | 789 | 829 | 744 | 804 | 566 | 694 | 784 | 858 | 808 |
| 2017 | 803 | 694 | 759 | 838 | 914 | 944 | 904 | 926 | 764 | 876 | 920 | 932 |
| 2018 | 782 | 817 | 874 | 801 | 759 | 954 | 819 | 823 | 802 | 900 | 819 | 812 |
| 2019 | 856 | 782 | 760 | 958 | 904 | 796 | 845 | 821 | 911 | 956 | 819 | 830 |
| 2020 | 753 | 759 | 472 | 580 | 721 | 613 | 687 | 716 | 640 | 759 | 761 | 700 |
| 2021 | 797 | 546 | 760 | 803 | 905 | 800 | 910 | 909 | 816 | 721 | 745 | 665 |
| 2022 | 716 | 724 | 697 | 822 | 893 | 888 | 749 | 690 | 670 | 755 | 783 | 813 |
| 2023 | 708 | 580 | 664 | 789 | 783 | 672 | 767 | 611 | 779 | 691 | 656 | 754 |
| 2024 | 535 | |||||||||||
| - = No Data Reported; -- = Not Applicable; NA = Not Available; W = Withheld to avoid disclosure of individual company data. |
| Release Date: 3/29/2024 |
| Next Release Date: 4/30/2024 |