|
Download Data (XLS File) |
|
||||||||
|
||||||||
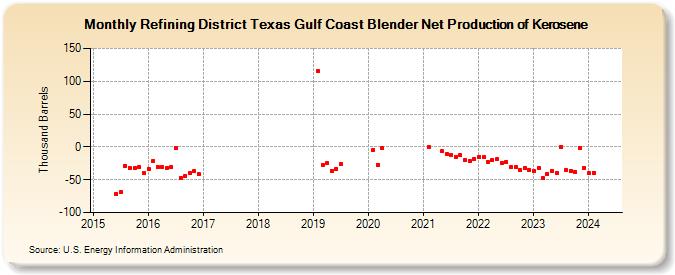
| Refining District Texas Gulf Coast Blender Net Production of Kerosene (Thousand Barrels) | ||||||||
| Year | Jan | Feb | Mar | Apr | May | Jun | Jul | Aug | Sep | Oct | Nov | Dec |
|---|---|---|---|---|---|---|---|---|---|---|---|---|
| 2015 | -71 | -69 | -29 | -32 | -32 | -31 | -40 | |||||
| 2016 | -33 | -21 | -30 | -30 | -32 | -30 | -1 | -47 | -44 | -40 | -37 | -42 |
| 2017 | -44 | -51 | -45 | |||||||||
| 2019 | 115 | -27 | -25 | -36 | -33 | -26 | ||||||
| 2020 | -4 | -27 | -2 | |||||||||
| 2021 | 0 | -7 | -11 | -12 | -15 | -13 | -20 | -21 | -18 | |||
| 2022 | -15 | -16 | -23 | -20 | -19 | -24 | -23 | -31 | -31 | -35 | -32 | -35 |
| 2023 | -36 | -32 | -47 | -41 | -36 | -40 | 0 | -35 | -36 | -38 | -1 | -32 |
| 2024 | -40 | -39 | -42 | -40 | -38 | -34 | ||||||
| - = No Data Reported; -- = Not Applicable; NA = Not Available; W = Withheld to avoid disclosure of individual company data. |
| Release Date: 8/30/2024 |
| Next Release Date: 9/30/2024 |