|
Download Data (XLS File) |
|
||||||||
|
||||||||
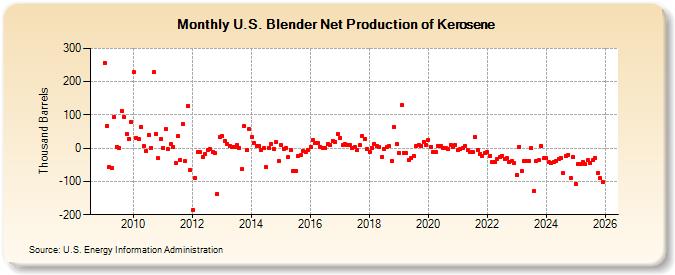
| U.S. Blender Net Production of Kerosene (Thousand Barrels) | ||||||||
| Year | Jan | Feb | Mar | Apr | May | Jun | Jul | Aug | Sep | Oct | Nov | Dec |
|---|---|---|---|---|---|---|---|---|---|---|---|---|
| 2009 | 257 | 68 | -56 | -61 | 93 | 5 | 0 | 113 | 95 | 43 | 27 | 78 |
| 2010 | 228 | 31 | 28 | 64 | 7 | -9 | 41 | 1 | 228 | 43 | -31 | 27 |
| 2011 | 0 | 57 | -3 | 12 | 5 | -46 | 36 | -36 | 72 | -40 | 128 | -65 |
| 2012 | -186 | -89 | -12 | -12 | -25 | -16 | -4 | -3 | -11 | -15 | -138 | 33 |
| 2013 | 36 | 23 | 12 | 6 | 4 | 3 | 10 | 0 | -63 | 66 | -6 | 57 |
| 2014 | 34 | 15 | 8 | 6 | -6 | 0 | -58 | 2 | 13 | -1 | 19 | -38 |
| 2015 | 9 | -1 | 0 | -26 | -4 | -68 | -68 | -23 | -21 | -8 | -11 | -6 |
| 2016 | 5 | 24 | 16 | 16 | 5 | 2 | 0 | 12 | 10 | 22 | 20 | 43 |
| 2017 | 31 | 9 | 13 | 11 | 10 | 1 | 3 | -4 | 9 | 37 | 29 | -2 |
| 2018 | -10 | 2 | 14 | 8 | 4 | -26 | -1 | 3 | 6 | -38 | 64 | 12 |
| 2019 | -14 | 129 | -13 | -15 | -35 | -30 | -24 | 7 | 10 | 8 | 20 | 11 |
| 2020 | 26 | 5 | -12 | -10 | 7 | 7 | 2 | 2 | -1 | 11 | 3 | 10 |
| 2021 | -6 | -3 | 0 | 8 | -6 | -10 | -11 | 34 | -6 | -17 | -22 | -15 |
| 2022 | -11 | -22 | -41 | -42 | -33 | -27 | -22 | -32 | -29 | -42 | -39 | -46 |
| 2023 | -81 | -11 | -68 | -39 | -40 | -39 | 0 | -129 | -39 | -37 | 7 | -30 |
| 2024 | -31 | |||||||||||
| - = No Data Reported; -- = Not Applicable; NA = Not Available; W = Withheld to avoid disclosure of individual company data. |
| Release Date: 3/29/2024 |
| Next Release Date: 4/30/2024 |
Referring Pages: