|
Download Data (XLS File) |
|
||||||||
|
||||||||
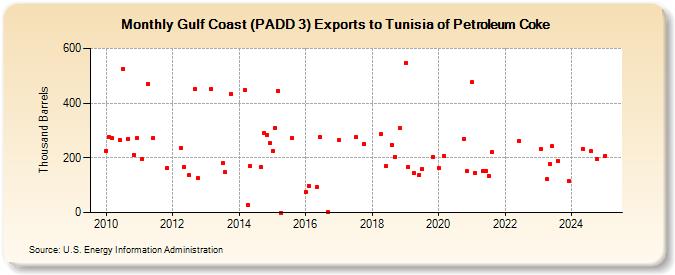
| Gulf Coast (PADD 3) Exports to Tunisia of Petroleum Coke (Thousand Barrels) | ||||||||
| Year | Jan | Feb | Mar | Apr | May | Jun | Jul | Aug | Sep | Oct | Nov | Dec |
|---|---|---|---|---|---|---|---|---|---|---|---|---|
| 2010 | 226 | 276 | 272 | 267 | 526 | 269 | 212 | 272 | ||||
| 2011 | 197 | 470 | 272 | 163 | ||||||||
| 2012 | 237 | 165 | 136 | 450 | 125 | |||||||
| 2013 | 452 | 180 | 147 | 434 | ||||||||
| 2014 | 448 | 29 | 170 | 165 | 289 | 284 | 253 | |||||
| 2015 | 225 | 310 | 446 | 0 | 272 | |||||||
| 2016 | 74 | 98 | 95 | 276 | 1 | |||||||
| 2017 | 264 | 275 | 251 | |||||||||
| 2018 | 286 | 170 | 248 | 204 | 308 | |||||||
| 2019 | 548 | 165 | 145 | 137 | 160 | 204 | ||||||
| 2020 | 163 | 205 | 270 | 151 | ||||||||
| 2021 | 477 | 146 | 153 | 151 | 135 | 220 | ||||||
| 2022 | 261 | |||||||||||
| 2023 | 231 | 121 | 178 | 242 | 188 | 114 | ||||||
| - = No Data Reported; -- = Not Applicable; NA = Not Available; W = Withheld to avoid disclosure of individual company data. |
| Release Date: 3/29/2024 |
| Next Release Date: 4/30/2024 |