|
Download Data (XLS File) |
|
||||||||
|
||||||||
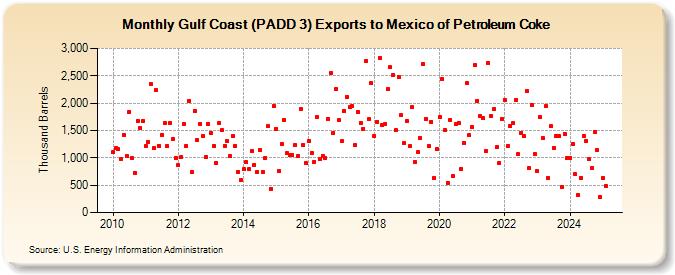
| Gulf Coast (PADD 3) Exports to Mexico of Petroleum Coke (Thousand Barrels) | ||||||||
| Year | Jan | Feb | Mar | Apr | May | Jun | Jul | Aug | Sep | Oct | Nov | Dec |
|---|---|---|---|---|---|---|---|---|---|---|---|---|
| 2010 | 1,100 | 1,179 | 1,153 | 978 | 1,423 | 1,038 | 1,844 | 993 | 728 | 1,675 | 1,549 | 1,678 |
| 2011 | 1,218 | 1,292 | 2,343 | 1,172 | 2,237 | 1,223 | 1,423 | 1,637 | 1,214 | 1,638 | 1,348 | 998 |
| 2012 | 863 | 1,007 | 1,623 | 1,221 | 2,044 | 740 | 1,865 | 1,327 | 1,624 | 1,408 | 1,011 | 1,618 |
| 2013 | 1,455 | 1,222 | 903 | 1,642 | 1,500 | 1,222 | 1,306 | 1,032 | 1,402 | 1,224 | 742 | 592 |
| 2014 | 788 | 921 | 787 | 1,120 | 875 | 743 | 1,140 | 745 | 999 | 1,576 | 439 | 1,948 |
| 2015 | 1,536 | 756 | 1,253 | 1,696 | 1,082 | 1,047 | 1,054 | 1,237 | 1,033 | 1,894 | 1,239 | 905 |
| 2016 | 1,306 | 1,096 | 931 | 1,739 | 980 | 1,035 | 999 | 1,714 | 2,544 | 1,455 | 2,261 | 1,695 |
| 2017 | 1,301 | 1,853 | 2,120 | 1,928 | 1,946 | 1,226 | 1,842 | 1,633 | 1,533 | 2,768 | 1,707 | 2,365 |
| 2018 | 1,404 | 1,664 | 2,827 | 1,597 | 1,612 | 2,260 | 2,652 | 2,515 | 1,503 | 2,470 | 1,777 | 1,264 |
| 2019 | 1,677 | 1,208 | 1,924 | 924 | 1,099 | 1,370 | 2,717 | 1,718 | 1,214 | 1,661 | 634 | 1,160 |
| 2020 | 1,747 | 2,441 | 1,507 | 549 | 1,699 | 675 | 1,610 | 1,642 | 797 | 1,273 | 2,363 | 1,412 |
| 2021 | 1,557 | 2,692 | 2,040 | 1,758 | 1,720 | 1,122 | 2,730 | 1,773 | 1,889 | 1,192 | 913 | 1,712 |
| 2022 | 2,064 | 1,214 | 1,581 | 1,631 | 2,056 | 1,063 | 1,462 | 1,396 | 2,219 | 813 | 1,971 | 1,066 |
| 2023 | 753 | 1,746 | 1,634 | 1,661 | 639 | 1,575 | 1,180 | 1,390 | 1,396 | 474 | 1,443 | 1,032 |
| 2024 | 1,002 | |||||||||||
| - = No Data Reported; -- = Not Applicable; NA = Not Available; W = Withheld to avoid disclosure of individual company data. |
| Release Date: 3/29/2024 |
| Next Release Date: 4/30/2024 |