|
Download Data (XLS File) |
|
||||||||
|
||||||||
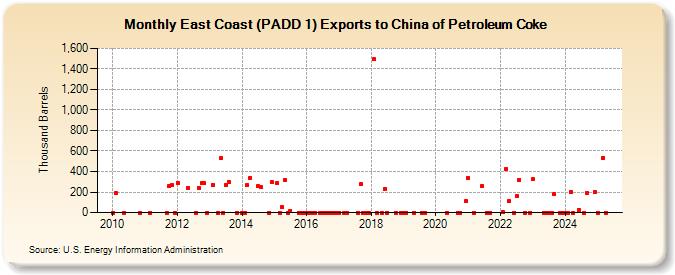
| East Coast (PADD 1) Exports to China of Petroleum Coke (Thousand Barrels) | ||||||||
| Year | Jan | Feb | Mar | Apr | May | Jun | Jul | Aug | Sep | Oct | Nov | Dec |
|---|---|---|---|---|---|---|---|---|---|---|---|---|
| 2010 | 0 | 186 | 0 | 0 | ||||||||
| 2011 | 0 | 0 | 261 | 269 | 0 | |||||||
| 2012 | 291 | 243 | 0 | 243 | 285 | 285 | 0 | |||||
| 2013 | 273 | 0 | 528 | 0 | 273 | 300 | 0 | |||||
| 2014 | 0 | 0 | 267 | 340 | 255 | 249 | 0 | 297 | ||||
| 2015 | 284 | 0 | 52 | 319 | 0 | 18 | 0 | 0 | 0 | |||
| 2016 | 0 | 0 | 0 | 0 | 0 | 0 | 0 | 0 | 0 | 0 | 0 | |
| 2017 | 0 | 0 | 0 | 0 | 275 | 0 | 0 | 0 | ||||
| 2018 | 1,492 | 0 | 0 | 230 | 0 | 0 | 0 | |||||
| 2019 | 0 | 0 | 0 | 0 | 0 | |||||||
| 2020 | 0 | 0 | 0 | 110 | ||||||||
| 2021 | 338 | 0 | 258 | 0 | 0 | |||||||
| 2022 | 1 | 424 | 111 | 0 | 157 | 322 | 0 | 0 | ||||
| 2023 | 324 | 0 | 0 | 0 | 0 | 182 | 0 | 0 | ||||
| 2024 | 0 | |||||||||||
| - = No Data Reported; -- = Not Applicable; NA = Not Available; W = Withheld to avoid disclosure of individual company data. |
| Release Date: 3/29/2024 |
| Next Release Date: 4/30/2024 |