|
Download Data (XLS File) |
|
||||||||
|
||||||||
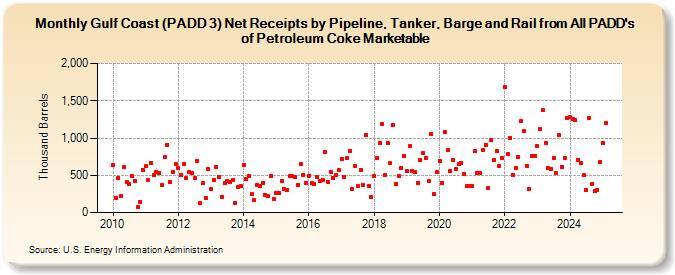
| Gulf Coast (PADD 3) Net Receipts by Pipeline, Tanker, Barge and Rail from All PADD's of Petroleum Coke Marketable (Thousand Barrels) | ||||||||
| Year | Jan | Feb | Mar | Apr | May | Jun | Jul | Aug | Sep | Oct | Nov | Dec |
|---|---|---|---|---|---|---|---|---|---|---|---|---|
| 2010 | 644 | 193 | 461 | 220 | 605 | 410 | 377 | 489 | 426 | 75 | 146 | 568 |
| 2011 | 621 | 435 | 664 | 499 | 540 | 535 | 370 | 742 | 909 | 412 | 546 | 647 |
| 2012 | 596 | 503 | 654 | 462 | 544 | 533 | 457 | 690 | 124 | 396 | 199 | 586 |
| 2013 | 318 | 439 | 608 | 478 | 211 | 395 | 418 | 406 | 434 | 133 | 346 | 352 |
| 2014 | 641 | 446 | 488 | 249 | 166 | 368 | 358 | 403 | 236 | 218 | 486 | 184 |
| 2015 | 256 | 258 | 424 | 312 | 309 | 496 | 484 | 473 | 369 | 649 | 509 | 395 |
| 2016 | 496 | 398 | 389 | 475 | 424 | 441 | 811 | 414 | 548 | 465 | 506 | 571 |
| 2017 | 725 | 471 | 726 | 824 | 316 | 621 | 354 | 577 | 366 | 1,042 | 363 | 213 |
| 2018 | 484 | 729 | 928 | 1,194 | 509 | 936 | 664 | 1,170 | 388 | 490 | 600 | 756 |
| 2019 | 559 | 891 | 553 | 543 | 395 | 703 | 793 | 737 | 419 | 1,051 | 253 | 545 |
| 2020 | 689 | 400 | 1,079 | 840 | 558 | 710 | 579 | 654 | 670 | 516 | 358 | 363 |
| 2021 | 362 | 821 | 535 | 525 | 835 | 907 | 328 | 968 | 711 | 820 | 628 | 729 |
| 2022 | 1,686 | 791 | 1,004 | 498 | 597 | 751 | 1,222 | 1,097 | 629 | 315 | 765 | 765 |
| 2023 | 890 | 1,119 | 1,375 | 936 | 593 | 589 | 736 | 529 | 1,039 | 614 | 729 | 1,273 |
| 2024 | 1,276 | 1,251 | 1,244 | 714 | ||||||||
| - = No Data Reported; -- = Not Applicable; NA = Not Available; W = Withheld to avoid disclosure of individual company data. |
| Release Date: 6/28/2024 |
| Next Release Date: 7/31/2024 |