|
Download Data (XLS File) |
|
||||||||
|
||||||||
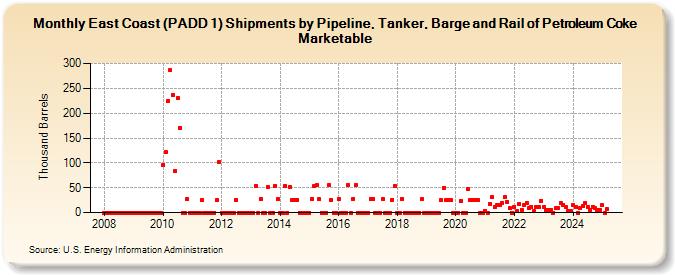
| East Coast (PADD 1) Shipments by Pipeline, Tanker, Barge and Rail of Petroleum Coke Marketable (Thousand Barrels) | ||||||||
| Year | Jan | Feb | Mar | Apr | May | Jun | Jul | Aug | Sep | Oct | Nov | Dec |
|---|---|---|---|---|---|---|---|---|---|---|---|---|
| 2008 | 0 | 0 | 0 | 0 | 0 | 0 | 0 | 0 | 0 | 0 | 0 | 0 |
| 2009 | 0 | 0 | 0 | 0 | 0 | 0 | 0 | 0 | 0 | 0 | 0 | 0 |
| 2010 | 96 | 121 | 225 | 286 | 237 | 84 | 231 | 171 | 0 | 0 | 27 | 0 |
| 2011 | 0 | 0 | 0 | 0 | 26 | 0 | 0 | 0 | 0 | 0 | 25 | 102 |
| 2012 | 0 | 0 | 0 | 0 | 0 | 0 | 26 | 0 | 0 | 0 | 0 | 0 |
| 2013 | 0 | 0 | 54 | 0 | 27 | 0 | 0 | 52 | 0 | 0 | 54 | 27 |
| 2014 | 0 | 0 | 54 | 0 | 52 | 26 | 26 | 26 | 0 | 0 | 0 | 0 |
| 2015 | 0 | 27 | 53 | 55 | 27 | 0 | 0 | 0 | 55 | 26 | 0 | 0 |
| 2016 | 27 | 0 | 0 | 0 | 55 | 0 | 28 | 55 | 0 | 0 | 0 | 0 |
| 2017 | 0 | 28 | 28 | 0 | 0 | 0 | 27 | 0 | 0 | 0 | 26 | 53 |
| 2018 | 0 | 0 | 28 | 0 | 0 | 0 | 0 | 0 | 0 | 0 | 27 | 0 |
| 2019 | 0 | 0 | 0 | 0 | 0 | 0 | 25 | 50 | 25 | 25 | 25 | 0 |
| 2020 | 0 | 0 | 24 | 0 | 0 | 47 | 25 | 25 | 25 | 25 | 0 | 0 |
| 2021 | 3 | 0 | 18 | 31 | 12 | 15 | 16 | 19 | 31 | 22 | 9 | 0 |
| 2022 | 12 | 3 | 18 | 6 | 15 | 20 | 9 | 12 | 3 | 12 | 12 | 24 |
| 2023 | 12 | 6 | 6 | 6 | 0 | 9 | 9 | 19 | 16 | 12 | 3 | 3 |
| 2024 | 15 | 12 | 0 | 9 | 15 | 18 | ||||||
| - = No Data Reported; -- = Not Applicable; NA = Not Available; W = Withheld to avoid disclosure of individual company data. |
| Release Date: 8/30/2024 |
| Next Release Date: 9/30/2024 |