|
Download Data (XLS File) |
|
||||||||
|
||||||||
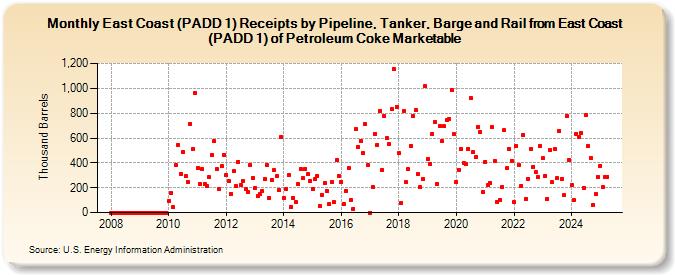
| East Coast (PADD 1) Receipts by Pipeline, Tanker, Barge and Rail from East Coast (PADD 1) of Petroleum Coke Marketable (Thousand Barrels) | ||||||||
| Year | Jan | Feb | Mar | Apr | May | Jun | Jul | Aug | Sep | Oct | Nov | Dec |
|---|---|---|---|---|---|---|---|---|---|---|---|---|
| 2008 | 0 | 0 | 0 | 0 | 0 | 0 | 0 | 0 | 0 | 0 | 0 | 0 |
| 2009 | 0 | 0 | 0 | 0 | 0 | 0 | 0 | 0 | 0 | 0 | 0 | 0 |
| 2010 | 95 | 154 | 41 | 379 | 545 | 311 | 490 | 294 | 246 | 713 | 510 | 966 |
| 2011 | 362 | 228 | 352 | 226 | 213 | 283 | 465 | 575 | 350 | 189 | 372 | 466 |
| 2012 | 303 | 253 | 152 | 333 | 217 | 410 | 225 | 255 | 187 | 164 | 382 | 282 |
| 2013 | 199 | 130 | 151 | 177 | 268 | 384 | 120 | 266 | 341 | 294 | 179 | 608 |
| 2014 | 119 | 190 | 302 | 48 | 119 | 87 | 227 | 354 | 277 | 352 | 307 | 254 |
| 2015 | 187 | 273 | 298 | 55 | 145 | 239 | 172 | 65 | 249 | 83 | 422 | 298 |
| 2016 | 246 | 70 | 176 | 359 | 104 | 31 | 674 | 528 | 576 | 477 | 710 | 379 |
| 2017 | 0 | 209 | 636 | 544 | 816 | 345 | 776 | 597 | 550 | 831 | 1,154 | 851 |
| 2018 | 477 | 77 | 814 | 243 | 348 | 539 | 777 | 824 | 314 | 203 | 270 | 1,016 |
| 2019 | 431 | 387 | 635 | 730 | 231 | 696 | 572 | 693 | 743 | 756 | 983 | 629 |
| 2020 | 250 | 343 | 509 | 400 | 389 | 510 | 921 | 485 | 445 | 692 | 647 | 162 |
| 2021 | 411 | 218 | 241 | 686 | 416 | 88 | 103 | 202 | 662 | 358 | 515 | 419 |
| 2022 | 81 | 535 | 386 | 214 | 625 | 110 | 272 | 512 | 369 | 323 | 290 | 536 |
| 2023 | 436 | 297 | 113 | 505 | 243 | 509 | 276 | 656 | 273 | 139 | 777 | 427 |
| 2024 | 224 | |||||||||||
| - = No Data Reported; -- = Not Applicable; NA = Not Available; W = Withheld to avoid disclosure of individual company data. |
| Release Date: 3/29/2024 |
| Next Release Date: 4/30/2024 |