|
Download Data (XLS File) |
|
||||||||
|
||||||||
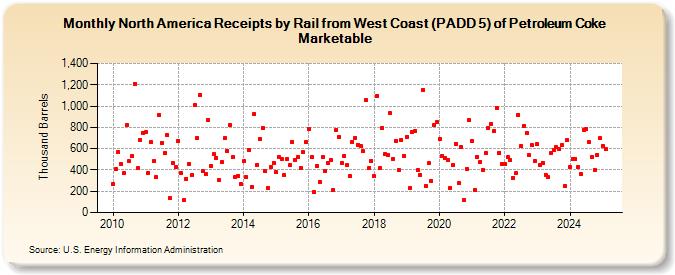
| North America Receipts by Rail from West Coast (PADD 5) of Petroleum Coke Marketable (Thousand Barrels) | ||||||||
| Year | Jan | Feb | Mar | Apr | May | Jun | Jul | Aug | Sep | Oct | Nov | Dec |
|---|---|---|---|---|---|---|---|---|---|---|---|---|
| 2010 | 268 | 408 | 567 | 457 | 371 | 824 | 481 | 527 | 1,211 | 418 | 684 | 748 |
| 2011 | 755 | 374 | 661 | 483 | 330 | 914 | 657 | 555 | 727 | 135 | 463 | 426 |
| 2012 | 673 | 369 | 114 | 317 | 459 | 355 | 1,009 | 699 | 1,106 | 387 | 366 | 867 |
| 2013 | 437 | 546 | 515 | 302 | 477 | 698 | 577 | 821 | 520 | 337 | 348 | 266 |
| 2014 | 480 | 332 | 588 | 244 | 927 | 449 | 691 | 795 | 386 | 228 | 432 | 465 |
| 2015 | 377 | 521 | 503 | 350 | 501 | 446 | 667 | 497 | 520 | 417 | 567 | 662 |
| 2016 | 782 | 521 | 189 | 435 | 290 | 523 | 389 | 464 | 494 | 211 | 775 | 711 |
| 2017 | 467 | 532 | 444 | 343 | 660 | 703 | 639 | 629 | 575 | 1,053 | 416 | 486 |
| 2018 | 339 | 1,098 | 414 | 798 | 548 | 545 | 932 | 507 | 673 | 404 | 686 | 529 |
| 2019 | 714 | 230 | 756 | 765 | 398 | 355 | 1,152 | 253 | 463 | 295 | 824 | 846 |
| 2020 | 692 | 535 | 508 | 490 | 229 | 444 | 648 | 273 | 615 | 115 | 410 | 868 |
| 2021 | 674 | 208 | 526 | 476 | 401 | 560 | 794 | 833 | 765 | 985 | 564 | 456 |
| 2022 | 460 | 518 | 489 | 329 | 368 | 919 | 624 | 813 | 743 | 540 | 630 | 482 |
| 2023 | 641 | 450 | 470 | 357 | 332 | 557 | 588 | 606 | 599 | 634 | 249 | 678 |
| 2024 | 417 | |||||||||||
| - = No Data Reported; -- = Not Applicable; NA = Not Available; W = Withheld to avoid disclosure of individual company data. |
| Release Date: 3/29/2024 |
| Next Release Date: 4/30/2024 |
Referring Pages: