|
Download Data (XLS File) |
|
||||||||
|
||||||||
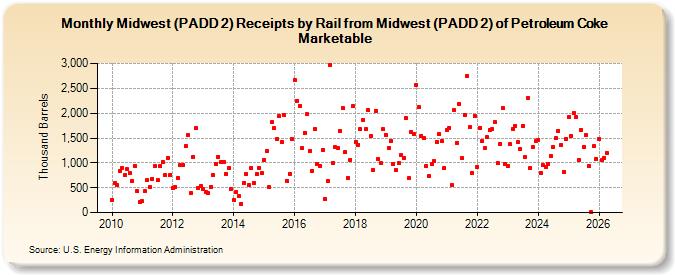
| Midwest (PADD 2) Receipts by Rail from Midwest (PADD 2) of Petroleum Coke Marketable (Thousand Barrels) | ||||||||
| Year | Jan | Feb | Mar | Apr | May | Jun | Jul | Aug | Sep | Oct | Nov | Dec |
|---|---|---|---|---|---|---|---|---|---|---|---|---|
| 2010 | 261 | 587 | 557 | 840 | 906 | 751 | 871 | 801 | 637 | 944 | 426 | 210 |
| 2011 | 225 | 427 | 655 | 522 | 683 | 928 | 646 | 930 | 1,012 | 750 | 1,106 | 757 |
| 2012 | 485 | 513 | 705 | 951 | 961 | 1,340 | 1,555 | 384 | 1,128 | 1,700 | 497 | 536 |
| 2013 | 468 | 414 | 384 | 520 | 750 | 984 | 1,127 | 1,010 | 1,022 | 782 | 898 | 482 |
| 2014 | 260 | 423 | 325 | 182 | 603 | 779 | 564 | 899 | 597 | 774 | 897 | 791 |
| 2015 | 1,060 | 1,240 | 508 | 1,816 | 1,693 | 1,479 | 1,939 | 1,424 | 1,965 | 637 | 783 | 1,480 |
| 2016 | 2,661 | 2,245 | 2,141 | 1,295 | 1,611 | 1,975 | 1,241 | 837 | 1,672 | 977 | 938 | 1,268 |
| 2017 | 279 | 626 | 2,975 | 1,004 | 1,311 | 1,298 | 1,647 | 2,098 | 1,217 | 701 | 1,061 | 2,143 |
| 2018 | 1,424 | 1,365 | 1,672 | 1,870 | 1,674 | 2,062 | 1,547 | 859 | 2,049 | 1,082 | 991 | 1,674 |
| 2019 | 1,563 | 1,307 | 1,447 | 982 | 851 | 995 | 1,149 | 1,107 | 1,903 | 689 | 1,630 | 1,586 |
| 2020 | 2,557 | 2,124 | 1,545 | 1,491 | 927 | 740 | 971 | 1,038 | 1,417 | 1,577 | 1,430 | 892 |
| 2021 | 1,655 | 1,711 | 551 | 2,056 | 1,408 | 2,188 | 1,097 | 1,967 | 2,746 | 1,719 | 792 | 1,944 |
| 2022 | 920 | 1,709 | 1,432 | 1,291 | 1,514 | 1,667 | 1,672 | 1,820 | 990 | 1,389 | 2,095 | 973 |
| 2023 | 939 | 1,370 | 1,682 | 1,751 | 1,420 | 1,280 | 1,737 | 1,109 | 2,306 | 901 | 1,325 | 1,170 |
| 2024 | 1,260 | |||||||||||
| - = No Data Reported; -- = Not Applicable; NA = Not Available; W = Withheld to avoid disclosure of individual company data. |
| Release Date: 3/29/2024 |
| Next Release Date: 4/30/2024 |
Referring Pages: