|
Download Data (XLS File) |
|
||||||||
|
||||||||
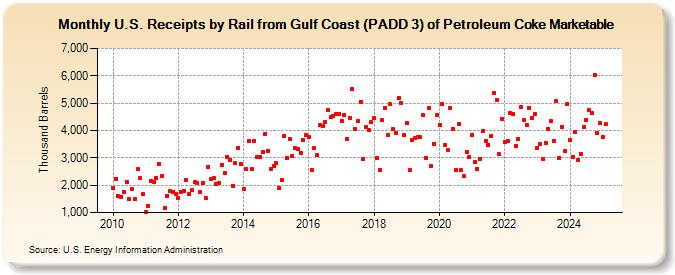
| U.S. Receipts by Rail from Gulf Coast (PADD 3) of Petroleum Coke Marketable (Thousand Barrels) | ||||||||
| Year | Jan | Feb | Mar | Apr | May | Jun | Jul | Aug | Sep | Oct | Nov | Dec |
|---|---|---|---|---|---|---|---|---|---|---|---|---|
| 2010 | 1,889 | 2,238 | 1,614 | 1,582 | 1,752 | 2,104 | 1,478 | 1,864 | 1,482 | 2,579 | 2,264 | 1,680 |
| 2011 | 1,020 | 1,238 | 2,145 | 2,123 | 2,246 | 2,777 | 2,327 | 1,167 | 1,617 | 1,782 | 1,764 | 1,689 |
| 2012 | 1,543 | 1,762 | 1,774 | 2,205 | 1,672 | 1,830 | 2,109 | 2,088 | 1,755 | 2,082 | 1,541 | 2,676 |
| 2013 | 2,212 | 2,252 | 2,035 | 2,065 | 2,741 | 2,441 | 3,043 | 2,907 | 1,980 | 2,797 | 3,363 | 2,769 |
| 2014 | 1,870 | 2,593 | 3,626 | 2,598 | 3,629 | 3,038 | 3,032 | 3,205 | 3,880 | 3,266 | 2,578 | 2,698 |
| 2015 | 2,804 | 1,913 | 2,206 | 3,805 | 3,006 | 3,689 | 3,063 | 3,366 | 3,313 | 3,164 | 3,642 | 3,834 |
| 2016 | 3,769 | 2,569 | 3,342 | 3,110 | 4,187 | 4,152 | 4,320 | 4,741 | 4,477 | 4,520 | 4,595 | 4,612 |
| 2017 | 4,360 | 4,560 | 3,696 | 4,471 | 5,521 | 4,057 | 4,331 | 5,056 | 2,975 | 4,133 | 4,024 | 4,318 |
| 2018 | 4,465 | 3,006 | 2,571 | 4,365 | 4,835 | 3,830 | 4,956 | 4,041 | 3,904 | 5,202 | 4,992 | 3,836 |
| 2019 | 4,289 | 2,544 | 3,660 | 3,708 | 3,746 | 3,759 | 4,548 | 3,008 | 4,817 | 2,704 | 3,506 | 4,550 |
| 2020 | 4,215 | 4,965 | 3,464 | 3,292 | 4,806 | 4,051 | 2,569 | 4,248 | 2,545 | 2,330 | 3,227 | 3,046 |
| 2021 | 3,824 | 2,857 | 2,599 | 2,971 | 3,977 | 3,610 | 3,481 | 3,781 | 5,386 | 5,130 | 3,128 | 4,416 |
| 2022 | 3,586 | 3,602 | 4,627 | 4,587 | 3,436 | 3,699 | 4,871 | 4,366 | 4,196 | 4,815 | 4,474 | 4,592 |
| 2023 | 3,374 | 3,494 | 2,972 | 3,553 | 4,069 | 4,345 | 3,622 | 5,063 | 3,002 | 4,119 | 3,254 | 4,972 |
| 2024 | 3,502 | |||||||||||
| - = No Data Reported; -- = Not Applicable; NA = Not Available; W = Withheld to avoid disclosure of individual company data. |
| Release Date: 3/29/2024 |
| Next Release Date: 4/30/2024 |
Referring Pages: