|
Download Data (XLS File) |
|
||||||||
|
||||||||
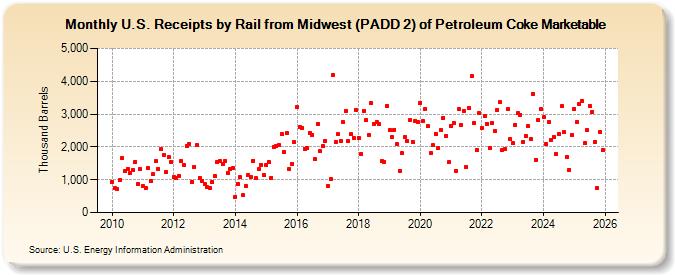
| U.S. Receipts by Rail from Midwest (PADD 2) of Petroleum Coke Marketable (Thousand Barrels) | ||||||||
| Year | Jan | Feb | Mar | Apr | May | Jun | Jul | Aug | Sep | Oct | Nov | Dec |
|---|---|---|---|---|---|---|---|---|---|---|---|---|
| 2010 | 943 | 737 | 724 | 996 | 1,659 | 1,261 | 1,333 | 1,201 | 1,293 | 1,554 | 871 | 1,324 |
| 2011 | 804 | 755 | 1,356 | 963 | 1,165 | 1,564 | 1,334 | 1,926 | 1,748 | 1,230 | 1,682 | 1,533 |
| 2012 | 1,089 | 1,039 | 1,126 | 1,556 | 1,449 | 2,025 | 2,100 | 930 | 1,401 | 2,043 | 1,063 | 970 |
| 2013 | 878 | 766 | 745 | 945 | 1,101 | 1,525 | 1,557 | 1,473 | 1,585 | 1,219 | 1,341 | 1,348 |
| 2014 | 487 | 882 | 1,072 | 520 | 803 | 1,147 | 1,084 | 1,580 | 1,040 | 1,320 | 1,457 | 1,153 |
| 2015 | 1,449 | 1,540 | 1,063 | 2,000 | 2,026 | 2,059 | 2,391 | 1,855 | 2,419 | 1,333 | 1,489 | 2,145 |
| 2016 | 3,204 | 2,602 | 2,578 | 1,936 | 1,952 | 2,421 | 2,366 | 1,618 | 2,711 | 1,864 | 2,012 | 2,193 |
| 2017 | 814 | 1,007 | 4,196 | 2,147 | 2,379 | 2,193 | 2,758 | 3,104 | 2,176 | 2,381 | 2,280 | 3,120 |
| 2018 | 2,282 | 1,782 | 3,101 | 2,823 | 2,367 | 3,336 | 2,708 | 2,760 | 2,696 | 1,565 | 1,546 | 3,246 |
| 2019 | 2,509 | 2,294 | 2,523 | 2,073 | 1,280 | 1,806 | 2,306 | 2,167 | 2,805 | 2,163 | 2,801 | 2,763 |
| 2020 | 3,349 | 2,778 | 3,143 | 2,623 | 1,800 | 2,043 | 2,396 | 1,979 | 2,507 | 2,891 | 2,341 | 1,525 |
| 2021 | 2,642 | 2,727 | 1,279 | 3,143 | 2,667 | 3,103 | 1,388 | 3,190 | 4,156 | 2,732 | 1,896 | 3,043 |
| 2022 | 2,589 | 2,929 | 2,710 | 1,976 | 2,728 | 2,488 | 3,137 | 3,353 | 1,907 | 1,946 | 3,141 | 2,235 |
| 2023 | 2,107 | 2,677 | 3,024 | 2,974 | 2,161 | 2,340 | 2,623 | 2,244 | 3,619 | 1,614 | 2,821 | 3,153 |
| 2024 | 2,889 | 2,093 | 2,851 | 2,539 | ||||||||
| - = No Data Reported; -- = Not Applicable; NA = Not Available; W = Withheld to avoid disclosure of individual company data. |
| Release Date: 6/28/2024 |
| Next Release Date: 7/31/2024 |
Referring Pages: