|
Download Data (XLS File) |
|
||||||||
|
||||||||
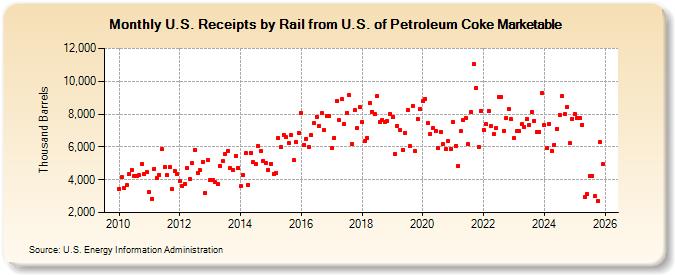
| U.S. Receipts by Rail from U.S. of Petroleum Coke Marketable (Thousand Barrels) | ||||||||
| Year | Jan | Feb | Mar | Apr | May | Jun | Jul | Aug | Sep | Oct | Nov | Dec |
|---|---|---|---|---|---|---|---|---|---|---|---|---|
| 2010 | 3,465 | 4,142 | 3,494 | 3,653 | 4,375 | 4,606 | 4,222 | 4,205 | 4,272 | 4,973 | 4,320 | 4,451 |
| 2011 | 3,232 | 2,846 | 4,671 | 4,098 | 4,300 | 5,843 | 4,784 | 4,264 | 4,765 | 3,408 | 4,504 | 4,373 |
| 2012 | 3,897 | 3,608 | 3,759 | 4,702 | 4,059 | 4,992 | 5,839 | 4,413 | 4,563 | 5,110 | 3,194 | 5,184 |
| 2013 | 3,988 | 4,006 | 3,842 | 3,743 | 4,866 | 5,116 | 5,590 | 5,766 | 4,689 | 4,604 | 5,472 | 4,744 |
| 2014 | 3,602 | 4,265 | 5,606 | 3,690 | 5,638 | 5,062 | 4,973 | 6,079 | 5,780 | 5,157 | 5,032 | 4,613 |
| 2015 | 4,984 | 4,371 | 4,428 | 6,533 | 5,965 | 6,727 | 6,578 | 6,236 | 6,701 | 5,172 | 6,282 | 6,862 |
| 2016 | 8,057 | 6,123 | 6,501 | 5,965 | 6,717 | 7,450 | 7,837 | 7,283 | 8,039 | 7,015 | 7,875 | 7,896 |
| 2017 | 5,926 | 6,563 | 8,775 | 7,608 | 8,896 | 7,374 | 8,088 | 9,136 | 6,181 | 8,242 | 7,137 | 8,404 |
| 2018 | 7,510 | 6,343 | 6,565 | 8,666 | 8,141 | 8,003 | 9,073 | 7,530 | 7,646 | 7,496 | 7,547 | 8,031 |
| 2019 | 7,807 | 5,592 | 7,289 | 7,047 | 5,824 | 6,869 | 8,244 | 6,032 | 8,498 | 5,742 | 7,708 | 8,311 |
| 2020 | 8,772 | 8,920 | 7,432 | 6,792 | 7,136 | 6,955 | 5,908 | 6,909 | 6,153 | 5,880 | 6,372 | 5,901 |
| 2021 | 7,501 | 6,057 | 4,839 | 6,950 | 7,620 | 7,749 | 6,151 | 8,123 | 11,053 | 9,608 | 5,996 | 8,214 |
| 2022 | 7,059 | 7,370 | 8,178 | 7,273 | 6,782 | 7,140 | 9,062 | 9,028 | 6,986 | 7,754 | 8,306 | 7,669 |
| 2023 | 6,546 | 6,938 | 6,960 | 7,365 | 7,219 | 7,685 | 7,351 | 8,129 | 7,600 | 6,899 | 6,924 | 8,997 |
| 2024 | 6,934 | |||||||||||
| - = No Data Reported; -- = Not Applicable; NA = Not Available; W = Withheld to avoid disclosure of individual company data. |
| Release Date: 3/29/2024 |
| Next Release Date: 4/30/2024 |
Referring Pages: