|
Download Data (XLS File) |
|
||||||||
|
||||||||
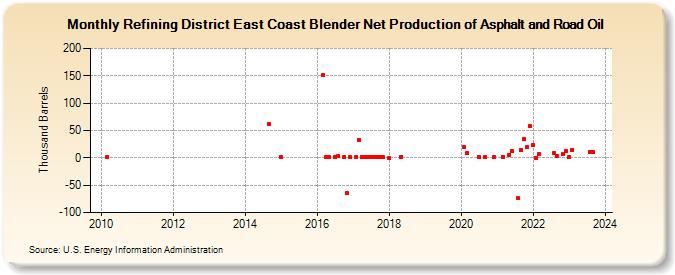
| Refining District East Coast Blender Net Production of Asphalt and Road Oil (Thousand Barrels) | ||||||||
| Year | Jan | Feb | Mar | Apr | May | Jun | Jul | Aug | Sep | Oct | Nov | Dec |
|---|---|---|---|---|---|---|---|---|---|---|---|---|
| 2010 | 1 | |||||||||||
| 2014 | 61 | |||||||||||
| 2015 | 1 | |||||||||||
| 2016 | 151 | 1 | 1 | 2 | 3 | 2 | -65 | 1 | ||||
| 2017 | 2 | 33 | 1 | 1 | 1 | 2 | 2 | 1 | 1 | 1 | ||
| 2018 | -1 | 2 | ||||||||||
| 2020 | 19 | 8 | 1 | 1 | 2 | |||||||
| 2021 | 2 | 6 | 12 | -74 | 14 | 34 | 19 | 58 | ||||
| 2022 | 23 | 0 | 7 | 8 | 3 | 7 | 12 | |||||
| 2023 | 1 | 14 | 11 | 10 | ||||||||
| - = No Data Reported; -- = Not Applicable; NA = Not Available; W = Withheld to avoid disclosure of individual company data. |
| Release Date: 3/29/2024 |
| Next Release Date: 4/30/2024 |