|
Download Data (XLS File) |
|
||||||||
|
||||||||
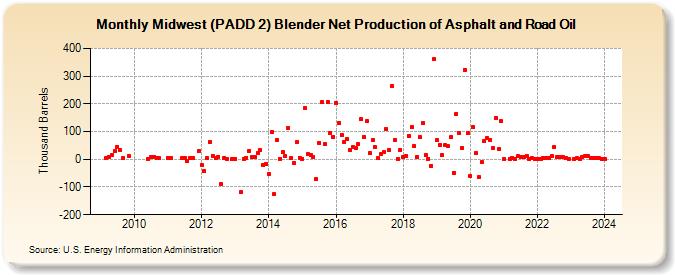
| Midwest (PADD 2) Blender Net Production of Asphalt and Road Oil (Thousand Barrels) | ||||||||
| Year | Jan | Feb | Mar | Apr | May | Jun | Jul | Aug | Sep | Oct | Nov | Dec |
|---|---|---|---|---|---|---|---|---|---|---|---|---|
| 2009 | 3 | 10 | 15 | 29 | 46 | 32 | 4 | 13 | ||||
| 2010 | 2 | 8 | 10 | 6 | 3 | |||||||
| 2011 | 4 | 5 | 3 | 5 | -7 | 5 | 4 | 29 | ||||
| 2012 | -19 | -43 | 4 | 63 | 13 | 6 | 10 | -91 | 5 | 2 | 1 | |
| 2013 | 1 | -119 | 0 | 6 | 31 | 7 | 8 | 23 | 34 | -20 | -16 | |
| 2014 | -54 | 99 | -127 | 70 | 2 | 25 | 11 | 112 | 5 | -12 | 62 | 6 |
| 2015 | 1 | 184 | 19 | 17 | 9 | -72 | 60 | 205 | 55 | 206 | 94 | 82 |
| 2016 | 203 | 132 | 88 | 64 | 74 | 35 | 45 | 40 | 55 | 145 | 82 | 137 |
| 2017 | 22 | 70 | 43 | 5 | 19 | 25 | 110 | 35 | 264 | 70 | 2 | 35 |
| 2018 | 8 | 12 | 85 | 115 | 48 | 9 | 81 | 131 | 15 | 2 | -24 | 361 |
| 2019 | 69 | 53 | 15 | 50 | 47 | 79 | -48 | 164 | 96 | 41 | 323 | 93 |
| 2020 | -60 | 116 | 22 | -65 | -10 | 67 | 76 | 70 | 39 | 150 | 37 | 137 |
| 2021 | 1 | 2 | 5 | 1 | 11 | 7 | 10 | 11 | 2 | 3 | 1 | |
| 2022 | 1 | 2 | 4 | 3 | 5 | 11 | 44 | 10 | 10 | 8 | 5 | 1 |
| 2023 | 1 | 3 | 1 | 10 | 12 | 11 | 6 | 5 | 3 | 3 | 1 | |
| 2024 | 2 | 2 | 1 | 6 | 5 | |||||||
| - = No Data Reported; -- = Not Applicable; NA = Not Available; W = Withheld to avoid disclosure of individual company data. |
| Release Date: 8/30/2024 |
| Next Release Date: 9/30/2024 |