|
Download Data (XLS File) |
|
||||||||
|
||||||||
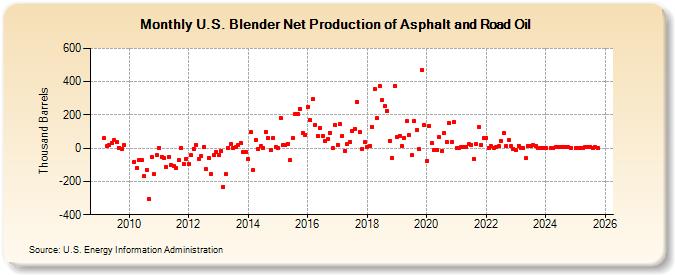
| U.S. Blender Net Production of Asphalt and Road Oil (Thousand Barrels) | ||||||||
| Year | Jan | Feb | Mar | Apr | May | Jun | Jul | Aug | Sep | Oct | Nov | Dec |
|---|---|---|---|---|---|---|---|---|---|---|---|---|
| 2009 | 60 | 11 | 17 | 31 | 49 | 35 | 4 | -4 | 18 | |||
| 2010 | -81 | -118 | -74 | -72 | -170 | -129 | -306 | -53 | -157 | -40 | ||
| 2011 | 4 | -50 | -57 | -113 | -50 | -102 | -105 | -121 | -73 | 4 | -97 | -63 |
| 2012 | -94 | -43 | -3 | 22 | -63 | -48 | 8 | -128 | -58 | -158 | -43 | -21 |
| 2013 | -39 | -18 | -232 | -158 | 4 | 25 | 2 | 6 | 18 | 32 | -24 | -21 |
| 2014 | -66 | 95 | -132 | 50 | -7 | 12 | 1 | 98 | 64 | -12 | 62 | 6 |
| 2015 | 2 | 184 | 19 | 17 | 28 | -72 | 60 | 205 | 204 | 238 | 94 | 82 |
| 2016 | 247 | 168 | 293 | 142 | 75 | 120 | 75 | 43 | 55 | 93 | -1 | 138 |
| 2017 | 22 | 143 | 75 | -15 | 26 | 38 | 104 | 115 | 278 | 96 | -4 | 35 |
| 2018 | 7 | 12 | 129 | 353 | 181 | 375 | 288 | 253 | 223 | 45 | -57 | 375 |
| 2019 | 69 | 74 | 15 | 62 | 161 | 79 | -42 | 163 | 112 | -5 | 471 | 140 |
| 2020 | -79 | 135 | 30 | -12 | -10 | 67 | -16 | 90 | 40 | 150 | 37 | 160 |
| 2021 | 1 | 3 | 6 | 5 | 8 | 23 | 21 | -64 | 25 | 129 | 22 | 60 |
| 2022 | 62 | 2 | 11 | 3 | 5 | 11 | 44 | 90 | 13 | 49 | 12 | -4 |
| 2023 | -13 | 15 | 2 | 1 | -63 | 12 | 11 | 17 | 15 | 3 | 3 | 1 |
| 2024 | 2 | |||||||||||
| - = No Data Reported; -- = Not Applicable; NA = Not Available; W = Withheld to avoid disclosure of individual company data. |
| Release Date: 3/29/2024 |
| Next Release Date: 4/30/2024 |