|
Download Data (XLS File) |
|
||||||||
|
||||||||
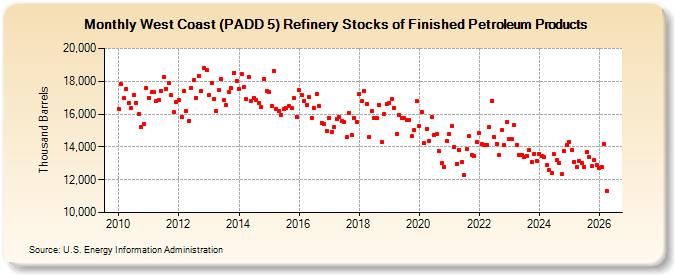
| West Coast (PADD 5) Refinery Stocks of Finished Petroleum Products (Thousand Barrels) | ||||||||
| Year | Jan | Feb | Mar | Apr | May | Jun | Jul | Aug | Sep | Oct | Nov | Dec |
|---|---|---|---|---|---|---|---|---|---|---|---|---|
| 2010 | 16,329 | 17,809 | 16,955 | 17,539 | 16,702 | 16,355 | 17,152 | 16,678 | 16,005 | 15,229 | 15,415 | 17,593 |
| 2011 | 16,991 | 17,323 | 17,318 | 16,800 | 16,855 | 17,427 | 18,241 | 17,551 | 17,909 | 17,135 | 16,111 | 16,760 |
| 2012 | 16,831 | 15,803 | 17,417 | 16,190 | 15,570 | 17,596 | 18,077 | 16,975 | 18,334 | 17,378 | 18,810 | 18,680 |
| 2013 | 17,158 | 17,897 | 16,903 | 16,171 | 17,439 | 18,136 | 16,830 | 16,544 | 17,327 | 17,577 | 18,507 | 18,031 |
| 2014 | 17,519 | 18,436 | 17,659 | 16,893 | 18,246 | 16,777 | 17,004 | 16,828 | 16,693 | 16,436 | 18,153 | 17,411 |
| 2015 | 17,359 | 16,511 | 18,636 | 16,325 | 16,193 | 15,939 | 16,280 | 16,366 | 16,477 | 16,342 | 16,950 | 15,797 |
| 2016 | 17,438 | 17,141 | 16,811 | 16,544 | 17,022 | 15,772 | 16,384 | 17,214 | 16,488 | 15,474 | 15,409 | 14,979 |
| 2017 | 15,788 | 14,917 | 15,192 | 15,718 | 15,822 | 15,555 | 15,488 | 14,579 | 16,057 | 14,725 | 15,749 | 15,546 |
| 2018 | 17,215 | 16,776 | 17,419 | 16,626 | 14,614 | 16,194 | 15,748 | 15,764 | 16,559 | 14,283 | 16,032 | 16,608 |
| 2019 | 16,679 | 16,940 | 16,385 | 14,783 | 15,973 | 15,756 | 15,755 | 15,632 | 15,620 | 14,655 | 15,004 | 16,781 |
| 2020 | 15,277 | 16,145 | 14,219 | 15,060 | 14,377 | 15,804 | 14,711 | 14,786 | 13,720 | 13,018 | 12,770 | 14,352 |
| 2021 | 14,802 | 15,302 | 14,008 | 12,965 | 13,825 | 13,091 | 12,262 | 13,853 | 14,639 | 13,515 | 13,422 | 14,299 |
| 2022 | 14,840 | 14,160 | 14,090 | 14,125 | 15,195 | 16,820 | 14,613 | 14,166 | 13,517 | 15,034 | 14,088 | 15,542 |
| 2023 | 14,543 | 14,633 | 15,369 | 14,141 | 13,506 | 13,526 | 13,373 | 13,451 | 13,584 | 13,081 | 13,585 | 13,133 |
| 2024 | 13,591 | |||||||||||
| - = No Data Reported; -- = Not Applicable; NA = Not Available; W = Withheld to avoid disclosure of individual company data. |
| Release Date: 3/29/2024 |
| Next Release Date: 4/30/2024 |