|
Download Data (XLS File) |
|
||||||||
|
||||||||
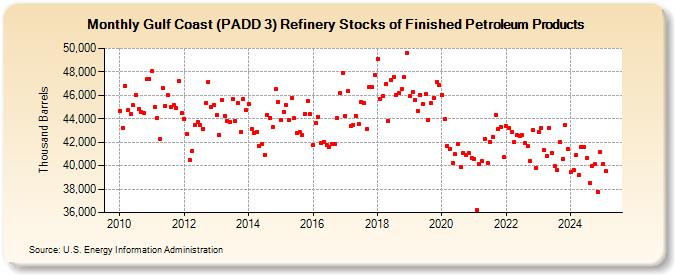
| Gulf Coast (PADD 3) Refinery Stocks of Finished Petroleum Products (Thousand Barrels) | ||||||||
| Year | Jan | Feb | Mar | Apr | May | Jun | Jul | Aug | Sep | Oct | Nov | Dec |
|---|---|---|---|---|---|---|---|---|---|---|---|---|
| 2010 | 44,641 | 43,253 | 46,796 | 44,743 | 44,366 | 45,140 | 46,065 | 44,815 | 44,534 | 44,490 | 47,361 | 47,416 |
| 2011 | 48,032 | 45,006 | 44,097 | 42,267 | 46,623 | 45,111 | 46,000 | 44,981 | 45,139 | 44,955 | 47,207 | 44,459 |
| 2012 | 43,977 | 42,736 | 40,450 | 41,230 | 43,463 | 43,752 | 43,470 | 43,153 | 45,336 | 47,172 | 44,995 | 45,207 |
| 2013 | 44,329 | 42,620 | 45,583 | 44,268 | 43,831 | 43,744 | 45,679 | 43,822 | 45,301 | 42,833 | 45,645 | 44,710 |
| 2014 | 45,232 | 43,124 | 42,777 | 42,890 | 41,713 | 41,883 | 40,912 | 44,334 | 44,080 | 43,262 | 46,551 | 45,424 |
| 2015 | 43,884 | 44,604 | 45,202 | 43,877 | 45,774 | 44,056 | 42,801 | 42,858 | 42,612 | 44,431 | 45,526 | 44,368 |
| 2016 | 41,735 | 43,635 | 44,189 | 41,965 | 42,059 | 41,758 | 41,612 | 41,837 | 41,834 | 44,055 | 46,200 | 47,860 |
| 2017 | 44,247 | 46,338 | 43,345 | 43,477 | 44,215 | 43,514 | 45,420 | 45,311 | 43,168 | 46,688 | 46,672 | 47,771 |
| 2018 | 49,134 | 45,685 | 45,920 | 46,924 | 43,840 | 47,290 | 47,579 | 46,040 | 46,183 | 46,538 | 47,523 | 49,649 |
| 2019 | 45,915 | 46,292 | 45,601 | 44,688 | 46,038 | 45,260 | 46,133 | 43,933 | 45,327 | 45,811 | 47,150 | 46,847 |
| 2020 | 46,057 | 43,993 | 41,656 | 41,444 | 40,246 | 40,957 | 41,858 | 39,889 | 41,080 | 40,939 | 41,037 | 40,689 |
| 2021 | 40,585 | 36,202 | 40,125 | 40,365 | 42,309 | 40,250 | 42,042 | 42,452 | 44,334 | 43,160 | 43,302 | 40,746 |
| 2022 | 43,370 | 43,169 | 42,877 | 42,015 | 42,623 | 42,532 | 42,603 | 41,893 | 41,634 | 40,395 | 42,998 | 39,794 |
| 2023 | 43,019 | 43,568 | 41,419 | 41,020 | 43,391 | 41,273 | 40,217 | 39,767 | 42,073 | 40,754 | 43,773 | 41,374 |
| 2024 | 39,421 | |||||||||||
| - = No Data Reported; -- = Not Applicable; NA = Not Available; W = Withheld to avoid disclosure of individual company data. |
| Release Date: 3/29/2024 |
| Next Release Date: 4/30/2024 |