|
Download Data (XLS File) |
|
||||||||
|
||||||||
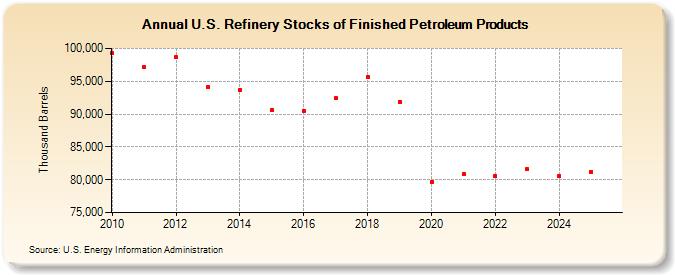
| U.S. Refinery Stocks of Finished Petroleum Products (Thousand Barrels) | ||||||||
| Decade | Year-0 | Year-1 | Year-2 | Year-3 | Year-4 | Year-5 | Year-6 | Year-7 | Year-8 | Year-9 |
|---|---|---|---|---|---|---|---|---|---|---|
| 2010's | 99,293 | 97,120 | 98,635 | 94,115 | 93,711 | 90,612 | 90,467 | 92,433 | 95,682 | 91,888 |
| 2020's | 79,673 | 80,802 | 80,605 | 81,543 |
| - = No Data Reported; -- = Not Applicable; NA = Not Available; W = Withheld to avoid disclosure of individual company data. |
| Release Date: 3/29/2024 |
| Next Release Date: 8/30/2024 |