|
Download Data (XLS File) |
|
||||||||
|
||||||||
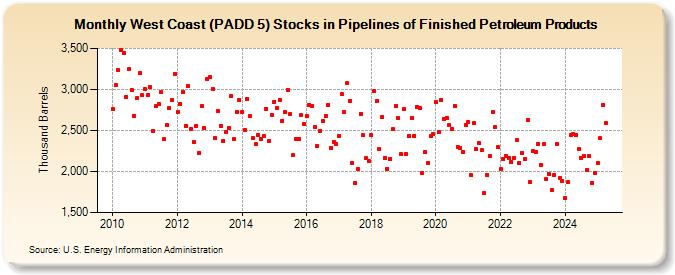
| West Coast (PADD 5) Stocks in Pipelines of Finished Petroleum Products (Thousand Barrels) | ||||||||
| Year | Jan | Feb | Mar | Apr | May | Jun | Jul | Aug | Sep | Oct | Nov | Dec |
|---|---|---|---|---|---|---|---|---|---|---|---|---|
| 2010 | 2,758 | 3,048 | 3,233 | 3,481 | 3,440 | 2,911 | 3,243 | 2,992 | 2,680 | 2,893 | 3,198 | 2,927 |
| 2011 | 3,000 | 2,937 | 3,026 | 2,498 | 2,793 | 2,819 | 2,963 | 2,395 | 2,564 | 2,773 | 2,871 | 3,192 |
| 2012 | 2,728 | 2,824 | 2,973 | 2,556 | 3,041 | 2,516 | 2,362 | 2,554 | 2,226 | 2,799 | 2,533 | 3,127 |
| 2013 | 3,147 | 3,008 | 2,403 | 2,734 | 2,553 | 2,377 | 2,486 | 2,530 | 2,922 | 2,398 | 2,726 | 2,872 |
| 2014 | 2,729 | 2,506 | 2,881 | 2,675 | 2,408 | 2,330 | 2,446 | 2,401 | 2,431 | 2,766 | 2,376 | 2,691 |
| 2015 | 2,850 | 2,771 | 2,873 | 2,621 | 2,720 | 2,999 | 2,703 | 2,199 | 2,399 | 2,400 | 2,685 | 2,576 |
| 2016 | 2,672 | 2,812 | 2,803 | 2,541 | 2,309 | 2,498 | 2,613 | 2,680 | 2,816 | 2,282 | 2,363 | 2,330 |
| 2017 | 2,436 | 2,939 | 2,722 | 3,075 | 2,863 | 2,107 | 1,862 | 2,035 | 2,703 | 2,441 | 2,160 | 2,128 |
| 2018 | 2,442 | 2,976 | 2,853 | 2,271 | 2,661 | 2,166 | 2,032 | 2,152 | 2,513 | 2,803 | 2,654 | 2,208 |
| 2019 | 2,760 | 2,212 | 2,427 | 2,651 | 2,438 | 2,790 | 2,772 | 1,977 | 2,234 | 2,108 | 2,427 | 2,461 |
| 2020 | 2,843 | 2,487 | 2,867 | 2,645 | 2,657 | 2,565 | 2,519 | 2,798 | 2,304 | 2,291 | 2,242 | 2,566 |
| 2021 | 2,601 | 1,952 | 2,590 | 2,273 | 2,347 | 2,257 | 1,736 | 1,961 | 2,189 | 2,723 | 2,538 | 2,295 |
| 2022 | 2,026 | 2,150 | 2,192 | 2,166 | 2,121 | 2,163 | 2,378 | 2,107 | 2,224 | 2,153 | 2,623 | 1,872 |
| 2023 | 2,252 | 2,233 | 2,338 | 2,081 | 2,330 | 1,904 | 1,971 | 1,772 | 1,963 | 2,422 | 1,918 | 1,887 |
| 2024 | 1,679 | 1,868 | 2,447 | 2,460 | ||||||||
| - = No Data Reported; -- = Not Applicable; NA = Not Available; W = Withheld to avoid disclosure of individual company data. |
| Release Date: 6/28/2024 |
| Next Release Date: 7/31/2024 |