|
Download Data (XLS File) |
|
||||||||
|
||||||||
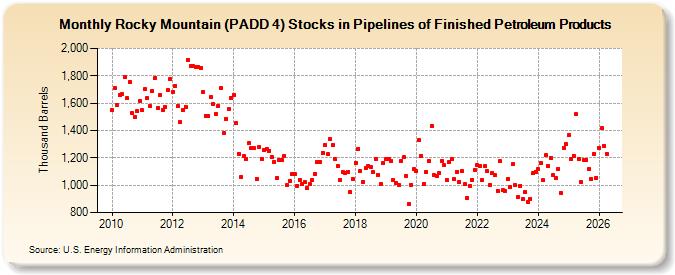
| Rocky Mountain (PADD 4) Stocks in Pipelines of Finished Petroleum Products (Thousand Barrels) | ||||||||
| Year | Jan | Feb | Mar | Apr | May | Jun | Jul | Aug | Sep | Oct | Nov | Dec |
|---|---|---|---|---|---|---|---|---|---|---|---|---|
| 2010 | 1,550 | 1,712 | 1,585 | 1,661 | 1,663 | 1,788 | 1,634 | 1,757 | 1,525 | 1,501 | 1,542 | 1,619 |
| 2011 | 1,547 | 1,701 | 1,635 | 1,576 | 1,689 | 1,781 | 1,564 | 1,660 | 1,553 | 1,572 | 1,693 | 1,777 |
| 2012 | 1,684 | 1,728 | 1,576 | 1,460 | 1,551 | 1,573 | 1,915 | 1,871 | 1,869 | 1,864 | 1,866 | 1,857 |
| 2013 | 1,681 | 1,509 | 1,505 | 1,643 | 1,593 | 1,524 | 1,581 | 1,711 | 1,382 | 1,487 | 1,555 | 1,639 |
| 2014 | 1,659 | 1,452 | 1,230 | 1,061 | 1,212 | 1,191 | 1,306 | 1,269 | 1,270 | 1,048 | 1,281 | 1,195 |
| 2015 | 1,256 | 1,265 | 1,252 | 1,209 | 1,172 | 1,054 | 1,185 | 1,186 | 1,214 | 998 | 1,032 | 1,081 |
| 2016 | 1,080 | 995 | 1,040 | 1,009 | 1,022 | 982 | 1,008 | 1,036 | 1,082 | 1,169 | 1,171 | 1,237 |
| 2017 | 1,295 | 1,226 | 1,336 | 1,294 | 1,188 | 1,143 | 1,040 | 1,098 | 1,092 | 1,098 | 950 | 1,046 |
| 2018 | 1,165 | 1,268 | 1,102 | 1,027 | 1,123 | 1,143 | 1,133 | 1,095 | 1,193 | 1,077 | 1,007 | 1,165 |
| 2019 | 1,195 | 1,190 | 1,177 | 1,035 | 1,018 | 1,005 | 1,180 | 1,204 | 1,069 | 861 | 1,005 | 1,116 |
| 2020 | 1,102 | 1,329 | 1,215 | 1,007 | 1,097 | 1,175 | 1,435 | 1,072 | 1,068 | 1,087 | 1,179 | 1,145 |
| 2021 | 1,037 | 1,172 | 1,190 | 1,045 | 1,099 | 1,025 | 1,102 | 1,006 | 906 | 996 | 1,039 | 1,113 |
| 2022 | 1,145 | 1,140 | 1,037 | 1,140 | 1,101 | 1,004 | 1,087 | 1,072 | 961 | 1,175 | 962 | 955 |
| 2023 | 1,047 | 985 | 1,152 | 998 | 915 | 997 | 896 | 950 | 878 | 902 | 1,086 | 1,098 |
| 2024 | 1,120 | 1,205 | 1,036 | 1,218 | ||||||||
| - = No Data Reported; -- = Not Applicable; NA = Not Available; W = Withheld to avoid disclosure of individual company data. |
| Release Date: 6/28/2024 |
| Next Release Date: 7/31/2024 |