|
Download Data (XLS File) |
|
||||||||
|
||||||||
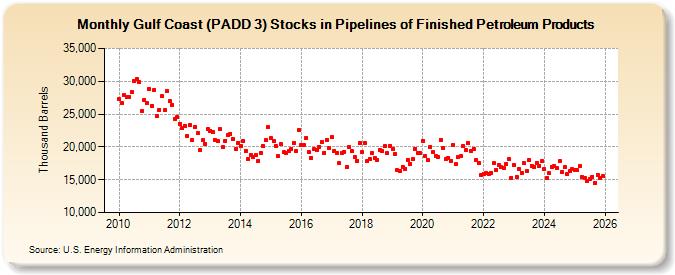
| Gulf Coast (PADD 3) Stocks in Pipelines of Finished Petroleum Products (Thousand Barrels) | ||||||||
| Year | Jan | Feb | Mar | Apr | May | Jun | Jul | Aug | Sep | Oct | Nov | Dec |
|---|---|---|---|---|---|---|---|---|---|---|---|---|
| 2010 | 27,314 | 26,718 | 27,830 | 27,561 | 27,621 | 28,348 | 30,046 | 30,269 | 29,858 | 25,462 | 27,205 | 26,621 |
| 2011 | 28,785 | 26,282 | 28,735 | 24,642 | 25,677 | 27,708 | 25,579 | 28,453 | 26,971 | 26,441 | 24,209 | 24,579 |
| 2012 | 23,551 | 22,893 | 23,207 | 21,636 | 23,293 | 20,978 | 23,083 | 22,053 | 19,492 | 21,001 | 20,505 | 22,712 |
| 2013 | 22,469 | 22,254 | 21,054 | 20,841 | 22,755 | 19,934 | 20,969 | 21,868 | 22,029 | 21,181 | 19,636 | 20,668 |
| 2014 | 20,088 | 20,901 | 19,448 | 18,186 | 18,731 | 18,413 | 18,724 | 17,874 | 19,045 | 20,135 | 20,996 | 22,989 |
| 2015 | 21,303 | 20,880 | 20,157 | 18,551 | 20,397 | 19,179 | 19,082 | 19,339 | 19,724 | 20,634 | 19,444 | 22,501 |
| 2016 | 20,291 | 20,229 | 21,411 | 19,218 | 18,313 | 19,604 | 19,512 | 20,023 | 20,763 | 19,125 | 21,125 | 19,870 |
| 2017 | 21,483 | 19,422 | 19,145 | 17,505 | 19,017 | 19,270 | 16,916 | 19,946 | 19,313 | 18,471 | 17,894 | 20,559 |
| 2018 | 19,190 | 20,628 | 17,795 | 18,186 | 19,062 | 18,362 | 18,058 | 19,587 | 19,345 | 20,067 | 19,048 | 20,178 |
| 2019 | 19,700 | 18,885 | 16,428 | 16,336 | 17,012 | 16,695 | 18,009 | 17,443 | 18,127 | 19,754 | 19,108 | 19,026 |
| 2020 | 20,960 | 18,551 | 17,960 | 20,008 | 19,220 | 18,669 | 18,510 | 21,080 | 19,785 | 18,097 | 18,353 | 17,906 |
| 2021 | 20,267 | 17,327 | 18,515 | 18,542 | 20,160 | 19,511 | 20,590 | 19,383 | 19,693 | 18,001 | 17,615 | 15,761 |
| 2022 | 15,918 | 16,053 | 15,896 | 16,029 | 17,475 | 16,552 | 17,310 | 16,908 | 16,755 | 17,339 | 18,103 | 15,315 |
| 2023 | 17,559 | 15,663 | 16,781 | 16,254 | 17,668 | 16,657 | 17,989 | 17,203 | 17,131 | 17,801 | 17,525 | 18,042 |
| 2024 | 16,672 | |||||||||||
| - = No Data Reported; -- = Not Applicable; NA = Not Available; W = Withheld to avoid disclosure of individual company data. |
| Release Date: 3/29/2024 |
| Next Release Date: 4/30/2024 |