|
Download Data (XLS File) |
|
||||||||
|
||||||||
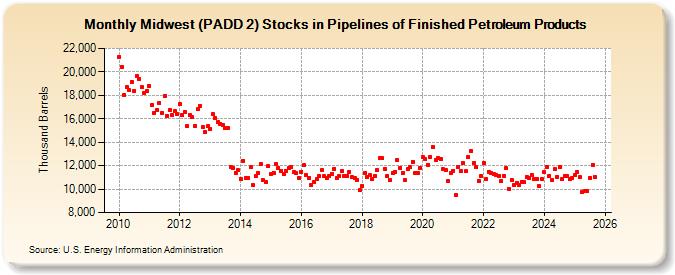
| Midwest (PADD 2) Stocks in Pipelines of Finished Petroleum Products (Thousand Barrels) | ||||||||
| Year | Jan | Feb | Mar | Apr | May | Jun | Jul | Aug | Sep | Oct | Nov | Dec |
|---|---|---|---|---|---|---|---|---|---|---|---|---|
| 2010 | 21,281 | 20,450 | 18,058 | 18,676 | 18,420 | 19,160 | 18,394 | 19,645 | 19,425 | 18,676 | 18,222 | 18,363 |
| 2011 | 18,784 | 17,173 | 16,489 | 16,761 | 17,336 | 16,498 | 17,928 | 16,265 | 16,731 | 16,334 | 16,637 | 16,379 |
| 2012 | 17,251 | 16,338 | 16,583 | 15,358 | 16,284 | 16,109 | 15,379 | 16,793 | 17,097 | 15,270 | 14,850 | 15,349 |
| 2013 | 15,134 | 16,365 | 16,067 | 15,738 | 15,574 | 15,492 | 15,221 | 15,187 | 11,910 | 11,816 | 11,408 | 11,597 |
| 2014 | 10,866 | 12,424 | 10,933 | 10,989 | 11,903 | 10,345 | 11,095 | 11,360 | 12,137 | 10,739 | 10,612 | 11,943 |
| 2015 | 11,274 | 11,405 | 12,163 | 11,838 | 11,573 | 11,247 | 11,538 | 11,759 | 11,892 | 11,449 | 11,345 | 10,933 |
| 2016 | 11,494 | 12,026 | 11,218 | 10,982 | 10,346 | 10,623 | 10,862 | 11,079 | 11,597 | 11,082 | 10,939 | 11,082 |
| 2017 | 11,313 | 11,740 | 10,966 | 11,144 | 11,560 | 11,110 | 11,147 | 11,493 | 10,994 | 10,914 | 10,796 | 9,897 |
| 2018 | 10,307 | 11,411 | 11,007 | 11,167 | 10,892 | 11,131 | 11,612 | 12,694 | 12,619 | 11,756 | 11,077 | 10,762 |
| 2019 | 11,366 | 11,483 | 12,483 | 11,819 | 11,380 | 10,749 | 11,693 | 11,843 | 12,344 | 11,401 | 11,406 | 11,803 |
| 2020 | 12,733 | 12,527 | 12,096 | 12,770 | 13,590 | 12,465 | 12,650 | 12,582 | 11,707 | 11,623 | 10,683 | 11,355 |
| 2021 | 11,555 | 9,475 | 11,919 | 11,516 | 12,189 | 11,508 | 12,772 | 13,255 | 12,215 | 11,883 | 10,721 | 11,104 |
| 2022 | 12,215 | 10,870 | 11,484 | 11,390 | 11,285 | 11,191 | 11,100 | 10,707 | 11,150 | 11,768 | 10,030 | 10,792 |
| 2023 | 10,380 | 10,646 | 10,387 | 10,759 | 10,707 | 11,171 | 11,080 | 11,323 | 10,950 | 10,895 | 10,280 | 10,872 |
| 2024 | 11,434 | |||||||||||
| - = No Data Reported; -- = Not Applicable; NA = Not Available; W = Withheld to avoid disclosure of individual company data. |
| Release Date: 3/29/2024 |
| Next Release Date: 4/30/2024 |