|
Download Data (XLS File) |
|
||||||||
|
||||||||
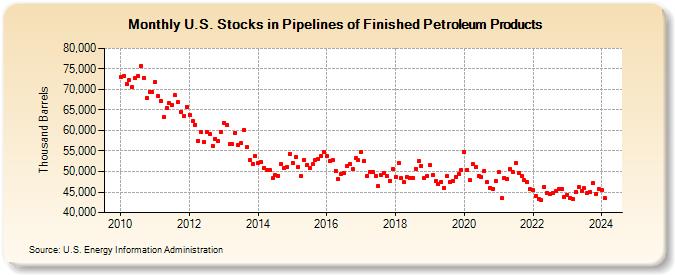
| U.S. Stocks in Pipelines of Finished Petroleum Products (Thousand Barrels) | ||||||||
| Year | Jan | Feb | Mar | Apr | May | Jun | Jul | Aug | Sep | Oct | Nov | Dec |
|---|---|---|---|---|---|---|---|---|---|---|---|---|
| 2010 | 72,953 | 73,327 | 71,273 | 72,223 | 70,527 | 72,731 | 73,258 | 75,632 | 72,855 | 67,880 | 69,409 | 69,412 |
| 2011 | 71,856 | 68,435 | 67,271 | 63,187 | 65,450 | 66,613 | 66,124 | 68,529 | 66,844 | 64,515 | 63,408 | 65,809 |
| 2012 | 63,825 | 62,248 | 61,366 | 57,539 | 59,571 | 57,193 | 59,535 | 59,183 | 56,268 | 57,943 | 57,362 | 59,727 |
| 2013 | 61,889 | 61,336 | 56,625 | 56,643 | 59,475 | 56,384 | 56,863 | 60,194 | 55,939 | 52,813 | 51,918 | 53,725 |
| 2014 | 52,015 | 52,200 | 50,950 | 50,388 | 50,308 | 48,353 | 49,053 | 48,920 | 51,859 | 50,788 | 51,159 | 54,304 |
| 2015 | 52,103 | 53,493 | 51,104 | 48,890 | 52,826 | 51,567 | 50,885 | 51,726 | 52,870 | 53,100 | 53,861 | 54,727 |
| 2016 | 53,750 | 52,445 | 52,801 | 50,191 | 48,075 | 49,407 | 49,535 | 51,338 | 51,913 | 50,596 | 53,273 | 52,686 |
| 2017 | 54,719 | 52,594 | 48,965 | 49,895 | 49,837 | 48,953 | 46,446 | 49,072 | 49,703 | 48,821 | 47,802 | 50,505 |
| 2018 | 48,782 | 52,103 | 48,333 | 47,348 | 48,777 | 48,469 | 48,523 | 50,690 | 52,524 | 51,464 | 48,513 | 48,912 |
| 2019 | 51,497 | 49,173 | 47,579 | 46,878 | 47,436 | 46,034 | 48,805 | 47,374 | 47,774 | 48,596 | 49,367 | 50,430 |
| 2020 | 54,802 | 50,453 | 47,823 | 51,816 | 51,179 | 48,910 | 48,569 | 50,167 | 47,339 | 46,084 | 45,858 | 47,572 |
| 2021 | 49,875 | 43,486 | 48,424 | 48,205 | 50,555 | 49,810 | 52,077 | 49,686 | 48,843 | 47,838 | 47,370 | 45,670 |
| 2022 | 45,381 | 43,919 | 43,279 | 42,957 | 46,229 | 44,798 | 44,543 | 44,875 | 45,143 | 45,696 | 45,698 | 43,724 |
| 2023 | 44,291 | 43,501 | 43,363 | 44,899 | 46,256 | 45,236 | 45,870 | 44,868 | 44,997 | 47,194 | 44,542 | 45,795 |
| 2024 | 45,535 | |||||||||||
| - = No Data Reported; -- = Not Applicable; NA = Not Available; W = Withheld to avoid disclosure of individual company data. |
| Release Date: 3/29/2024 |
| Next Release Date: 4/30/2024 |