|
Download Data (XLS File) |
|
||||||||
|
||||||||
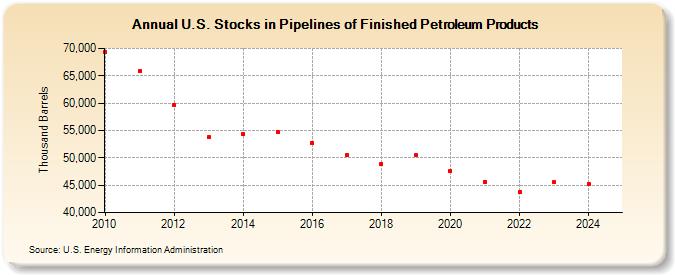
| U.S. Stocks in Pipelines of Finished Petroleum Products (Thousand Barrels) | ||||||||
| Decade | Year-0 | Year-1 | Year-2 | Year-3 | Year-4 | Year-5 | Year-6 | Year-7 | Year-8 | Year-9 |
|---|---|---|---|---|---|---|---|---|---|---|
| 2010's | 69,412 | 65,809 | 59,727 | 53,725 | 54,304 | 54,727 | 52,686 | 50,505 | 48,912 | 50,430 |
| 2020's | 47,572 | 45,670 | 43,724 | 45,519 | 45,244 |
| - = No Data Reported; -- = Not Applicable; NA = Not Available; W = Withheld to avoid disclosure of individual company data. |
| Release Date: 6/30/2025 |
| Next Release Date: 8/29/2025 |