|
Download Data (XLS File) |
|
||||||||
|
||||||||
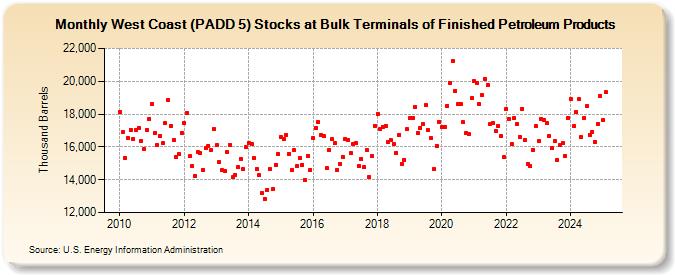
| West Coast (PADD 5) Stocks at Bulk Terminals of Finished Petroleum Products (Thousand Barrels) | ||||||||
| Year | Jan | Feb | Mar | Apr | May | Jun | Jul | Aug | Sep | Oct | Nov | Dec |
|---|---|---|---|---|---|---|---|---|---|---|---|---|
| 2010 | 18,103 | 16,881 | 15,328 | 16,547 | 17,049 | 16,481 | 17,045 | 17,167 | 16,374 | 15,882 | 17,050 | 17,708 |
| 2011 | 18,612 | 16,863 | 16,113 | 16,653 | 16,215 | 17,440 | 18,844 | 17,289 | 16,421 | 15,404 | 15,569 | 16,857 |
| 2012 | 17,435 | 18,080 | 15,419 | 14,822 | 14,233 | 15,683 | 15,618 | 14,614 | 15,934 | 16,081 | 15,825 | 17,084 |
| 2013 | 16,108 | 15,063 | 14,582 | 14,550 | 15,686 | 16,133 | 14,138 | 14,306 | 14,786 | 15,287 | 14,646 | 15,976 |
| 2014 | 16,266 | 16,163 | 15,308 | 14,660 | 14,293 | 13,178 | 12,827 | 13,402 | 14,644 | 13,414 | 14,919 | 15,597 |
| 2015 | 16,623 | 16,476 | 16,744 | 15,588 | 14,582 | 15,783 | 14,808 | 15,322 | 14,906 | 14,013 | 15,446 | 14,620 |
| 2016 | 16,548 | 17,153 | 17,499 | 16,729 | 16,642 | 14,714 | 15,825 | 16,476 | 16,207 | 14,592 | 14,985 | 15,413 |
| 2017 | 16,469 | 16,441 | 15,627 | 16,201 | 16,207 | 14,845 | 15,289 | 14,754 | 15,800 | 14,162 | 15,422 | 17,295 |
| 2018 | 18,032 | 17,097 | 17,240 | 17,279 | 16,269 | 16,391 | 16,189 | 15,656 | 16,743 | 14,987 | 15,221 | 17,064 |
| 2019 | 17,733 | 17,762 | 18,458 | 16,845 | 17,145 | 17,368 | 18,550 | 17,007 | 16,532 | 14,664 | 16,058 | 17,540 |
| 2020 | 17,199 | 17,228 | 18,506 | 19,903 | 21,226 | 19,419 | 18,625 | 18,602 | 17,487 | 16,850 | 16,798 | 18,977 |
| 2021 | 19,989 | 19,900 | 18,598 | 19,148 | 20,125 | 19,765 | 17,419 | 17,481 | 16,966 | 17,282 | 16,644 | 15,359 |
| 2022 | 18,314 | 17,712 | 16,164 | 17,776 | 17,389 | 16,631 | 18,333 | 16,413 | 14,952 | 14,815 | 15,828 | 17,252 |
| 2023 | 16,403 | 17,832 | 17,800 | 17,538 | 16,708 | 16,017 | 16,418 | 15,220 | 16,106 | 16,256 | 15,452 | 17,645 |
| 2024 | 18,888 | |||||||||||
| - = No Data Reported; -- = Not Applicable; NA = Not Available; W = Withheld to avoid disclosure of individual company data. |
| Release Date: 3/29/2024 |
| Next Release Date: 4/30/2024 |