|
Download Data (XLS File) |
|
||||||||
|
||||||||
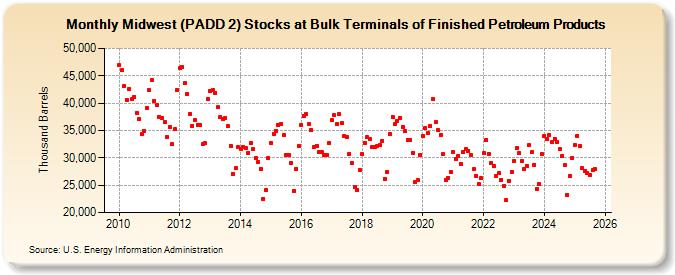
| Midwest (PADD 2) Stocks at Bulk Terminals of Finished Petroleum Products (Thousand Barrels) | ||||||||
| Year | Jan | Feb | Mar | Apr | May | Jun | Jul | Aug | Sep | Oct | Nov | Dec |
|---|---|---|---|---|---|---|---|---|---|---|---|---|
| 2010 | 46,882 | 45,966 | 43,134 | 40,632 | 42,619 | 40,661 | 41,172 | 38,224 | 37,129 | 34,367 | 34,872 | 39,138 |
| 2011 | 42,345 | 44,193 | 40,442 | 39,581 | 37,525 | 37,235 | 36,638 | 33,851 | 35,638 | 32,514 | 35,190 | 42,385 |
| 2012 | 46,355 | 46,629 | 43,606 | 41,671 | 38,059 | 35,875 | 36,826 | 36,063 | 35,925 | 32,462 | 32,622 | 40,679 |
| 2013 | 42,134 | 42,395 | 41,911 | 39,243 | 37,504 | 37,020 | 37,315 | 35,847 | 32,199 | 27,115 | 28,055 | 31,903 |
| 2014 | 31,701 | 31,982 | 31,802 | 30,910 | 32,727 | 31,568 | 29,911 | 29,261 | 27,995 | 22,524 | 24,154 | 29,969 |
| 2015 | 32,698 | 34,433 | 34,823 | 35,990 | 36,233 | 34,123 | 30,554 | 30,543 | 29,092 | 24,025 | 28,018 | 32,169 |
| 2016 | 35,988 | 37,729 | 37,982 | 36,134 | 35,081 | 31,956 | 32,187 | 31,112 | 30,981 | 30,489 | 30,530 | 32,747 |
| 2017 | 36,859 | 37,737 | 36,119 | 37,993 | 36,339 | 34,011 | 33,781 | 30,761 | 28,968 | 24,624 | 24,170 | 27,809 |
| 2018 | 30,618 | 32,719 | 33,752 | 33,431 | 32,047 | 31,922 | 32,238 | 32,388 | 33,084 | 26,197 | 27,466 | 34,382 |
| 2019 | 37,509 | 36,158 | 36,814 | 37,362 | 35,656 | 34,894 | 33,270 | 33,212 | 30,947 | 25,669 | 25,910 | 30,579 |
| 2020 | 33,970 | 35,388 | 34,463 | 35,899 | 40,713 | 36,477 | 35,051 | 34,136 | 30,632 | 25,924 | 26,374 | 27,380 |
| 2021 | 31,114 | 29,830 | 30,336 | 28,957 | 31,125 | 31,561 | 31,309 | 30,597 | 27,885 | 26,703 | 25,138 | 26,242 |
| 2022 | 30,799 | 33,289 | 30,790 | 29,038 | 28,467 | 26,699 | 27,149 | 26,010 | 24,858 | 22,214 | 25,796 | 27,481 |
| 2023 | 29,351 | 31,806 | 30,900 | 29,450 | 27,975 | 28,559 | 32,290 | 31,010 | 28,749 | 24,383 | 25,310 | 30,704 |
| 2024 | 34,191 | 33,670 | 34,321 | 32,956 | 33,694 | 32,938 | ||||||
| - = No Data Reported; -- = Not Applicable; NA = Not Available; W = Withheld to avoid disclosure of individual company data. |
| Release Date: 8/30/2024 |
| Next Release Date: 9/30/2024 |