|
Download Data (XLS File) |
|
||||||||
|
||||||||
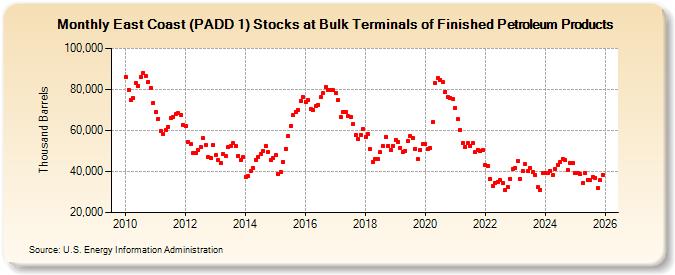
| East Coast (PADD 1) Stocks at Bulk Terminals of Finished Petroleum Products (Thousand Barrels) | ||||||||
| Year | Jan | Feb | Mar | Apr | May | Jun | Jul | Aug | Sep | Oct | Nov | Dec |
|---|---|---|---|---|---|---|---|---|---|---|---|---|
| 2010 | 86,000 | 79,864 | 74,773 | 75,615 | 82,974 | 81,675 | 85,945 | 88,111 | 86,357 | 83,749 | 80,838 | 73,532 |
| 2011 | 68,995 | 65,656 | 59,783 | 58,339 | 60,214 | 61,822 | 66,032 | 66,651 | 67,934 | 68,324 | 67,771 | 62,893 |
| 2012 | 62,026 | 54,326 | 53,365 | 49,186 | 49,256 | 50,285 | 51,855 | 56,129 | 52,978 | 46,988 | 46,526 | 52,807 |
| 2013 | 47,893 | 45,686 | 44,233 | 48,539 | 47,727 | 51,931 | 52,204 | 53,751 | 52,302 | 47,773 | 45,579 | 47,146 |
| 2014 | 37,388 | 37,624 | 40,308 | 41,926 | 45,779 | 47,300 | 48,317 | 50,033 | 52,342 | 49,474 | 45,503 | 46,524 |
| 2015 | 47,868 | 38,726 | 39,881 | 44,664 | 51,133 | 57,286 | 62,105 | 67,379 | 69,013 | 70,109 | 74,297 | 76,428 |
| 2016 | 73,910 | 74,885 | 70,409 | 69,928 | 71,831 | 72,542 | 76,082 | 78,040 | 81,225 | 79,676 | 79,880 | 79,508 |
| 2017 | 78,449 | 74,842 | 66,521 | 68,791 | 69,233 | 66,982 | 66,329 | 62,968 | 57,614 | 55,831 | 57,819 | 60,496 |
| 2018 | 56,747 | 58,348 | 50,753 | 44,678 | 46,218 | 46,302 | 49,366 | 52,422 | 56,832 | 52,638 | 50,521 | 52,441 |
| 2019 | 55,377 | 54,539 | 51,547 | 49,640 | 50,023 | 54,717 | 57,089 | 56,134 | 51,193 | 45,949 | 50,653 | 53,314 |
| 2020 | 53,530 | 50,977 | 51,347 | 64,026 | 83,136 | 85,511 | 84,828 | 83,489 | 78,876 | 76,208 | 75,899 | 75,159 |
| 2021 | 71,128 | 65,375 | 60,184 | 53,857 | 52,180 | 53,834 | 52,210 | 53,904 | 49,366 | 50,729 | 49,935 | 50,591 |
| 2022 | 43,192 | 42,867 | 36,530 | 33,164 | 34,406 | 35,098 | 35,719 | 34,612 | 30,870 | 32,461 | 36,491 | 41,345 |
| 2023 | 41,882 | 45,248 | 36,563 | 40,061 | 43,097 | 40,302 | 41,942 | 39,889 | 38,296 | 32,466 | 31,211 | 39,451 |
| 2024 | 39,196 | |||||||||||
| - = No Data Reported; -- = Not Applicable; NA = Not Available; W = Withheld to avoid disclosure of individual company data. |
| Release Date: 3/29/2024 |
| Next Release Date: 4/30/2024 |