|
Download Data (XLS File) |
|
||||||||
|
||||||||
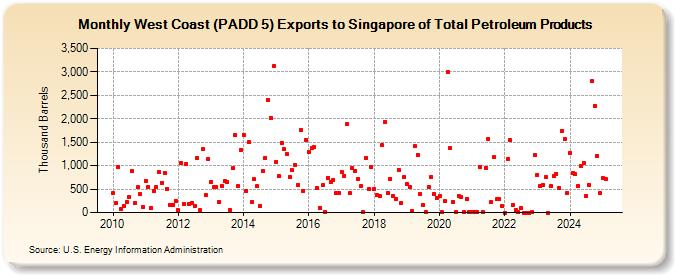
| West Coast (PADD 5) Exports to Singapore of Total Petroleum Products (Thousand Barrels) | ||||||||
| Year | Jan | Feb | Mar | Apr | May | Jun | Jul | Aug | Sep | Oct | Nov | Dec |
|---|---|---|---|---|---|---|---|---|---|---|---|---|
| 2010 | 414 | 201 | 974 | 71 | 135 | 227 | 325 | 885 | 200 | 535 | 388 | 117 |
| 2011 | 668 | 553 | 100 | 470 | 544 | 859 | 636 | 840 | 505 | 167 | 156 | 253 |
| 2012 | 54 | 1,061 | 186 | 1,031 | 181 | 203 | 139 | 1,168 | 44 | 1,348 | 378 | 1,134 |
| 2013 | 659 | 539 | 538 | 221 | 573 | 664 | 647 | 46 | 940 | 1,651 | 575 | 1,337 |
| 2014 | 1,660 | 464 | 1,499 | 228 | 708 | 559 | 147 | 880 | 1,166 | 2,407 | 2,024 | 3,119 |
| 2015 | 1,085 | 772 | 1,482 | 1,347 | 1,244 | 767 | 897 | 1,005 | 593 | 1,755 | 468 | 1,557 |
| 2016 | 1,298 | 1,367 | 1,395 | 526 | 107 | 582 | 21 | 746 | 648 | 703 | 418 | 420 |
| 2017 | 867 | 779 | 1,881 | 412 | 954 | 892 | 725 | 558 | 17 | 1,173 | 500 | 974 |
| 2018 | 497 | 375 | 351 | 1,437 | 1,936 | 417 | 725 | 359 | 296 | 917 | 213 | 753 |
| 2019 | 601 | 551 | 24 | 1,409 | 1,232 | 395 | 161 | 21 | 549 | 760 | 401 | 318 |
| 2020 | 349 | 5 | 237 | 2,990 | 1,371 | 222 | 10 | 349 | 334 | 17 | 289 | 14 |
| 2021 | 18 | 16 | 15 | 981 | 10 | 951 | 1,575 | 225 | 1,179 | 283 | 294 | 145 |
| 2022 | 1 | 1,136 | 1,541 | 170 | 51 | 16 | 91 | 0 | 1 | 1 | 2 | 1,222 |
| 2023 | 771 | 504 | 578 | 1,602 | 399 | 715 | 556 | 805 | 1 | 1,746 | 1,562 | 412 |
| 2024 | 1,273 | |||||||||||
| - = No Data Reported; -- = Not Applicable; NA = Not Available; W = Withheld to avoid disclosure of individual company data. |
| Release Date: 3/29/2024 |
| Next Release Date: 4/30/2024 |