|
Download Data (XLS File) |
|
||||||||
|
||||||||
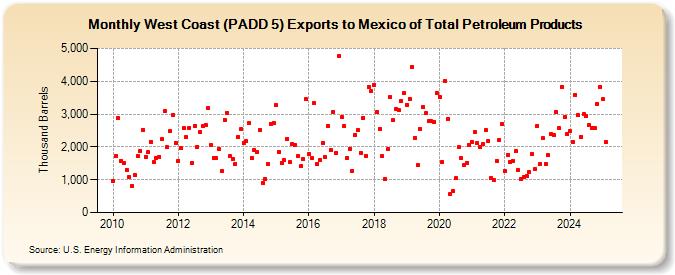
| West Coast (PADD 5) Exports to Mexico of Total Petroleum Products (Thousand Barrels) | ||||||||
| Year | Jan | Feb | Mar | Apr | May | Jun | Jul | Aug | Sep | Oct | Nov | Dec |
|---|---|---|---|---|---|---|---|---|---|---|---|---|
| 2010 | 954 | 1,729 | 2,873 | 1,581 | 1,518 | 1,301 | 1,082 | 803 | 1,144 | 1,719 | 1,881 | 2,529 |
| 2011 | 1,707 | 1,831 | 2,159 | 1,543 | 1,649 | 1,704 | 2,234 | 3,084 | 1,987 | 2,473 | 2,980 | 2,132 |
| 2012 | 1,580 | 1,956 | 2,566 | 2,293 | 2,573 | 1,506 | 2,637 | 2,008 | 2,447 | 2,630 | 2,674 | 3,174 |
| 2013 | 2,051 | 1,663 | 1,648 | 1,926 | 1,270 | 2,833 | 3,046 | 1,722 | 1,640 | 1,490 | 2,309 | 2,539 |
| 2014 | 2,123 | 2,169 | 2,715 | 1,675 | 1,914 | 1,837 | 2,512 | 893 | 1,019 | 1,466 | 2,709 | 2,737 |
| 2015 | 3,274 | 1,856 | 1,502 | 1,588 | 2,255 | 1,530 | 2,101 | 2,065 | 1,712 | 1,416 | 1,625 | 3,447 |
| 2016 | 1,793 | 1,656 | 3,330 | 1,486 | 1,597 | 2,129 | 1,694 | 2,651 | 1,891 | 3,071 | 1,816 | 4,783 |
| 2017 | 2,912 | 2,625 | 1,658 | 1,951 | 1,266 | 2,375 | 2,514 | 1,827 | 2,893 | 1,735 | 3,832 | 3,695 |
| 2018 | 3,900 | 3,063 | 2,555 | 1,714 | 1,022 | 1,928 | 3,523 | 2,809 | 3,163 | 3,110 | 3,394 | 3,639 |
| 2019 | 3,289 | 3,469 | 4,444 | 2,279 | 1,440 | 2,558 | 3,206 | 3,024 | 2,774 | 2,778 | 2,769 | 3,654 |
| 2020 | 3,531 | 1,542 | 4,011 | 2,846 | 563 | 646 | 1,040 | 1,987 | 1,652 | 1,442 | 1,521 | 2,062 |
| 2021 | 2,152 | 2,445 | 2,104 | 1,992 | 2,091 | 2,505 | 2,191 | 1,051 | 978 | 1,573 | 2,218 | 2,691 |
| 2022 | 1,267 | 1,751 | 1,536 | 1,585 | 1,865 | 1,285 | 1,017 | 1,086 | 1,126 | 1,235 | 1,791 | 1,314 |
| 2023 | 2,641 | 1,490 | 2,267 | 1,483 | 1,752 | 2,432 | 2,368 | 3,096 | 2,560 | 3,977 | 2,908 | 2,385 |
| 2024 | 2,477 | |||||||||||
| - = No Data Reported; -- = Not Applicable; NA = Not Available; W = Withheld to avoid disclosure of individual company data. |
| Release Date: 3/29/2024 |
| Next Release Date: 4/30/2024 |