|
Download Data (XLS File) |
|
||||||||
|
||||||||
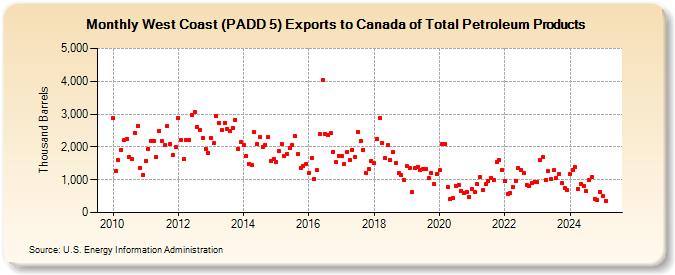
| West Coast (PADD 5) Exports to Canada of Total Petroleum Products (Thousand Barrels) | ||||||||
| Year | Jan | Feb | Mar | Apr | May | Jun | Jul | Aug | Sep | Oct | Nov | Dec |
|---|---|---|---|---|---|---|---|---|---|---|---|---|
| 2010 | 2,865 | 1,274 | 1,586 | 1,906 | 2,203 | 2,254 | 1,701 | 1,622 | 2,429 | 2,644 | 1,360 | 1,159 |
| 2011 | 1,580 | 1,945 | 2,180 | 2,176 | 1,679 | 2,493 | 2,193 | 2,058 | 2,637 | 2,095 | 1,758 | 1,988 |
| 2012 | 2,882 | 2,213 | 1,620 | 2,221 | 2,225 | 2,974 | 3,066 | 2,602 | 2,515 | 2,282 | 1,932 | 1,821 |
| 2013 | 2,284 | 2,109 | 2,953 | 2,731 | 2,523 | 2,740 | 2,559 | 2,485 | 2,579 | 2,830 | 1,951 | 2,142 |
| 2014 | 2,070 | 1,714 | 1,493 | 1,452 | 2,441 | 2,089 | 2,305 | 1,989 | 2,070 | 2,296 | 1,578 | 1,626 |
| 2015 | 1,555 | 1,878 | 2,098 | 1,725 | 1,785 | 1,963 | 2,052 | 2,321 | 1,782 | 1,368 | 1,403 | 1,490 |
| 2016 | 1,218 | 1,670 | 1,019 | 1,281 | 2,378 | 4,025 | 2,406 | 2,357 | 2,414 | 1,857 | 1,534 | 1,712 |
| 2017 | 1,725 | 1,490 | 1,853 | 1,615 | 1,916 | 1,701 | 2,464 | 2,170 | 1,913 | 1,196 | 1,324 | 1,556 |
| 2018 | 1,498 | 2,246 | 2,870 | 2,105 | 1,653 | 2,045 | 1,602 | 1,830 | 1,513 | 1,204 | 1,135 | 1,000 |
| 2019 | 1,413 | 1,369 | 617 | 1,344 | 1,391 | 1,306 | 1,337 | 1,320 | 1,041 | 1,213 | 884 | 1,184 |
| 2020 | 1,287 | 2,101 | 2,102 | 782 | 409 | 439 | 824 | 853 | 666 | 584 | 630 | 474 |
| 2021 | 711 | 616 | 860 | 1,073 | 692 | 862 | 948 | 1,065 | 989 | 1,538 | 1,587 | 1,305 |
| 2022 | 954 | 578 | 604 | 787 | 969 | 1,351 | 1,293 | 1,199 | 850 | 806 | 898 | 939 |
| 2023 | 956 | 1,435 | 1,669 | 967 | 1,177 | 1,007 | 1,290 | 1,043 | 1,189 | 887 | 733 | 678 |
| 2024 | 1,175 | |||||||||||
| - = No Data Reported; -- = Not Applicable; NA = Not Available; W = Withheld to avoid disclosure of individual company data. |
| Release Date: 3/29/2024 |
| Next Release Date: 4/30/2024 |