|
Download Data (XLS File) |
|
||||||||
|
||||||||
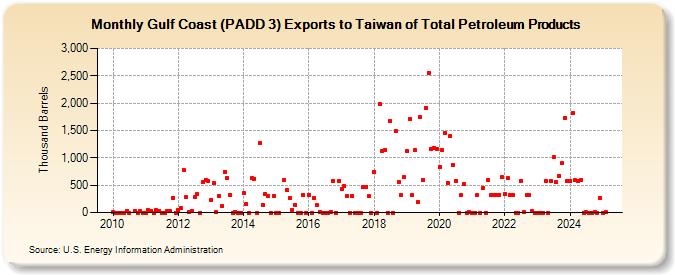
| Gulf Coast (PADD 3) Exports to Taiwan of Total Petroleum Products (Thousand Barrels) | ||||||||
| Year | Jan | Feb | Mar | Apr | May | Jun | Jul | Aug | Sep | Oct | Nov | Dec |
|---|---|---|---|---|---|---|---|---|---|---|---|---|
| 2010 | 7 | 0 | 0 | 0 | 0 | 22 | 0 | 33 | 0 | 24 | 0 | |
| 2011 | 0 | 46 | 32 | 0 | 42 | 34 | 0 | 0 | 23 | 23 | 272 | 0 |
| 2012 | 38 | 75 | 781 | 276 | 4 | 34 | 284 | 338 | 0 | 556 | 604 | 577 |
| 2013 | 237 | 535 | 3 | 308 | 126 | 750 | 632 | 326 | 1 | 15 | 0 | 0 |
| 2014 | 349 | 159 | 0 | 629 | 621 | 0 | 1,273 | 142 | 334 | 310 | 0 | 305 |
| 2015 | 0 | 0 | 589 | 411 | 263 | 49 | 145 | 0 | 0 | 321 | 0 | |
| 2016 | 330 | 0 | 270 | 133 | 18 | 0 | 0 | 1 | 14 | 581 | 0 | 578 |
| 2017 | 436 | 477 | 299 | 0 | 297 | 0 | 0 | 0 | 460 | 476 | 296 | 0 |
| 2018 | 747 | 0 | 1,981 | 1,131 | 1,150 | 0 | 1,670 | 1 | 1,486 | 564 | 323 | 654 |
| 2019 | 1,128 | 1,714 | 318 | 1,137 | 191 | 1,738 | 591 | 1,917 | 2,559 | 1,160 | 1,177 | 1,161 |
| 2020 | 824 | 1,143 | 1,449 | 549 | 1,407 | 877 | 582 | 0 | 319 | 514 | 0 | 2 |
| 2021 | 0 | 1 | 327 | 1 | 453 | 1 | 591 | 320 | 326 | 320 | 320 | 644 |
| 2022 | 336 | 625 | 325 | 320 | 1 | 0 | 578 | 2 | 330 | 325 | 22 | 0 |
| 2023 | 0 | 0 | 1 | 583 | 1 | 581 | 1,011 | 555 | 445 | 1,125 | 1,725 | 581 |
| 2024 | 579 | |||||||||||
| - = No Data Reported; -- = Not Applicable; NA = Not Available; W = Withheld to avoid disclosure of individual company data. |
| Release Date: 3/29/2024 |
| Next Release Date: 4/30/2024 |