|
Download Data (XLS File) |
|
||||||||
|
||||||||
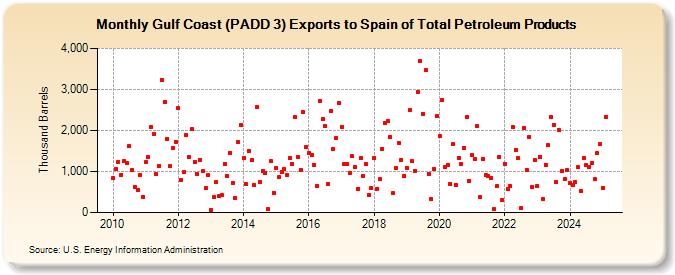
| Gulf Coast (PADD 3) Exports to Spain of Total Petroleum Products (Thousand Barrels) | ||||||||
| Year | Jan | Feb | Mar | Apr | May | Jun | Jul | Aug | Sep | Oct | Nov | Dec |
|---|---|---|---|---|---|---|---|---|---|---|---|---|
| 2010 | 831 | 1,062 | 1,239 | 921 | 1,262 | 1,219 | 1,610 | 1,034 | 627 | 557 | 905 | 391 |
| 2011 | 1,226 | 1,349 | 2,094 | 1,918 | 928 | 1,141 | 3,238 | 2,704 | 1,799 | 1,128 | 1,563 | 1,730 |
| 2012 | 2,539 | 804 | 983 | 1,893 | 1,357 | 2,042 | 1,240 | 934 | 1,285 | 1,003 | 602 | 903 |
| 2013 | 57 | 371 | 741 | 393 | 416 | 1,188 | 896 | 1,460 | 724 | 349 | 1,715 | 2,128 |
| 2014 | 1,328 | 691 | 1,500 | 1,279 | 672 | 2,568 | 746 | 1,011 | 975 | 77 | 1,251 | 483 |
| 2015 | 1,097 | 863 | 982 | 1,061 | 920 | 1,326 | 1,182 | 2,334 | 1,350 | 1,040 | 2,444 | 1,602 |
| 2016 | 1,457 | 1,408 | 1,169 | 652 | 2,706 | 2,274 | 2,112 | 702 | 2,471 | 1,538 | 1,821 | 2,669 |
| 2017 | 2,093 | 1,191 | 1,172 | 963 | 1,369 | 1,109 | 584 | 1,329 | 883 | 1,171 | 420 | 594 |
| 2018 | 1,332 | 580 | 808 | 1,551 | 2,183 | 2,233 | 1,844 | 475 | 1,097 | 1,706 | 1,287 | 888 |
| 2019 | 1,088 | 2,499 | 1,253 | 1,016 | 2,940 | 3,691 | 2,412 | 3,470 | 943 | 320 | 1,056 | 2,350 |
| 2020 | 1,864 | 2,744 | 1,117 | 1,168 | 688 | 1,664 | 681 | 1,340 | 1,172 | 1,578 | 2,333 | 776 |
| 2021 | 1,395 | 1,304 | 2,100 | 370 | 1,301 | 923 | 895 | 852 | 85 | 639 | 1,364 | 308 |
| 2022 | 1,185 | 576 | 643 | 2,078 | 1,533 | 1,324 | 109 | 2,057 | 1,047 | 1,842 | 615 | 1,275 |
| 2023 | 728 | 1,359 | 357 | 852 | 1,529 | 2,325 | 2,145 | 744 | 2,009 | 1,022 | 473 | 1,035 |
| 2024 | 721 | |||||||||||
| - = No Data Reported; -- = Not Applicable; NA = Not Available; W = Withheld to avoid disclosure of individual company data. |
| Release Date: 3/29/2024 |
| Next Release Date: 4/30/2024 |