|
Download Data (XLS File) |
|
||||||||
|
||||||||
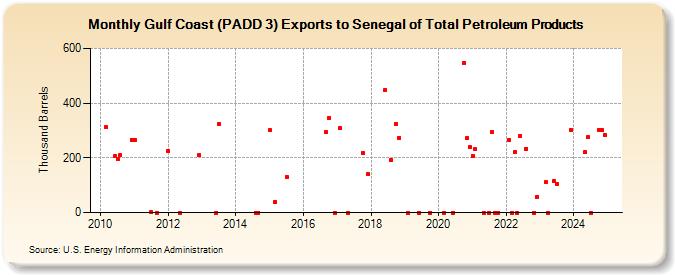
| Gulf Coast (PADD 3) Exports to Senegal of Total Petroleum Products (Thousand Barrels) | ||||||||
| Year | Jan | Feb | Mar | Apr | May | Jun | Jul | Aug | Sep | Oct | Nov | Dec |
|---|---|---|---|---|---|---|---|---|---|---|---|---|
| 2010 | 312 | 206 | 195 | 210 | 266 | |||||||
| 2011 | 266 | 2 | 0 | |||||||||
| 2012 | 226 | 0 | 210 | |||||||||
| 2013 | 0 | 325 | ||||||||||
| 2014 | 0 | 0 | ||||||||||
| 2015 | 300 | 40 | 130 | |||||||||
| 2016 | 294 | 346 | 0 | |||||||||
| 2017 | 308 | 0 | 218 | 140 | ||||||||
| 2018 | 448 | 193 | 322 | 274 | ||||||||
| 2019 | 0 | 0 | 0 | |||||||||
| 2020 | 0 | 0 | 548 | 271 | 239 | |||||||
| 2021 | 207 | 231 | 0 | 0 | 293 | 0 | 0 | |||||
| 2022 | 267 | 0 | 220 | 0 | 280 | 234 | 0 | 58 | ||||
| 2023 | 110 | 0 | 114 | 106 | 303 | |||||||
| - = No Data Reported; -- = Not Applicable; NA = Not Available; W = Withheld to avoid disclosure of individual company data. |
| Release Date: 3/29/2024 |
| Next Release Date: 4/30/2024 |