|
Download Data (XLS File) |
|
||||||||
|
||||||||
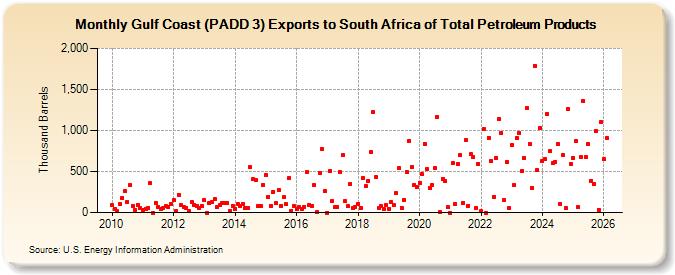
| Gulf Coast (PADD 3) Exports to South Africa of Total Petroleum Products (Thousand Barrels) | ||||||||
| Year | Jan | Feb | Mar | Apr | May | Jun | Jul | Aug | Sep | Oct | Nov | Dec |
|---|---|---|---|---|---|---|---|---|---|---|---|---|
| 2010 | 87 | 48 | 13 | 100 | 179 | 259 | 131 | 338 | 84 | 36 | 96 | 51 |
| 2011 | 35 | 47 | 58 | 357 | 0 | 120 | 70 | 42 | 50 | 75 | 67 | 104 |
| 2012 | 154 | 24 | 220 | 94 | 62 | 59 | 14 | 124 | 98 | 74 | 61 | 82 |
| 2013 | 147 | 0 | 116 | 128 | 163 | 62 | 93 | 115 | 118 | 119 | 23 | 83 |
| 2014 | 46 | 107 | 82 | 110 | 57 | 60 | 552 | 404 | 402 | 83 | 83 | 341 |
| 2015 | 455 | 193 | 86 | 254 | 112 | 279 | 86 | 184 | 99 | 418 | 23 | 77 |
| 2016 | 44 | 73 | 46 | 72 | 491 | 93 | 86 | 330 | 9 | 482 | 777 | 259 |
| 2017 | 0 | 509 | 141 | 63 | 66 | 491 | 697 | 136 | 74 | 351 | 57 | 72 |
| 2018 | 109 | 60 | 421 | 319 | 390 | 736 | 1,221 | 432 | 55 | 75 | 42 | 90 |
| 2019 | 49 | 124 | 87 | 233 | 540 | 60 | 159 | 495 | 872 | 554 | 337 | 308 |
| 2020 | 366 | 466 | 841 | 527 | 300 | 335 | 547 | 1,166 | 4 | 403 | 381 | 65 |
| 2021 | 0 | 603 | 110 | 594 | 700 | 121 | 879 | 84 | 710 | 675 | 53 | 597 |
| 2022 | 15 | 1,016 | 0 | 913 | 631 | 194 | 667 | 1,137 | 965 | 147 | 615 | 57 |
| 2023 | 853 | 292 | 1,053 | 1,008 | 467 | 670 | 1,265 | 891 | 290 | 1,808 | 461 | 1,027 |
| 2024 | 365 | 645 | 1,201 | 744 | ||||||||
| - = No Data Reported; -- = Not Applicable; NA = Not Available; W = Withheld to avoid disclosure of individual company data. |
| Release Date: 6/28/2024 |
| Next Release Date: 7/31/2024 |