|
Download Data (XLS File) |
|
||||||||
|
||||||||
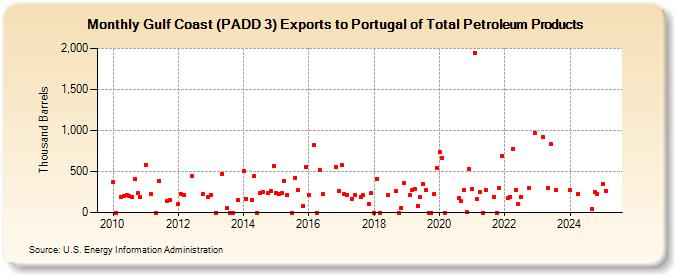
| Gulf Coast (PADD 3) Exports to Portugal of Total Petroleum Products (Thousand Barrels) | ||||||||
| Year | Jan | Feb | Mar | Apr | May | Jun | Jul | Aug | Sep | Oct | Nov | Dec |
|---|---|---|---|---|---|---|---|---|---|---|---|---|
| 2010 | 368 | 0 | 193 | 199 | 217 | 199 | 192 | 411 | 236 | 193 | ||
| 2011 | 584 | 224 | 0 | 387 | 143 | 152 | ||||||
| 2012 | 110 | 228 | 214 | 447 | 226 | 186 | ||||||
| 2013 | 220 | 0 | 473 | 54 | 0 | 0 | 147 | |||||
| 2014 | 512 | 165 | 155 | 445 | 0 | 233 | 245 | 236 | 267 | 573 | ||
| 2015 | 237 | 229 | 241 | 380 | 217 | 0 | 427 | 275 | 81 | 560 | ||
| 2016 | 211 | 820 | 0 | 523 | 226 | 550 | 263 | |||||
| 2017 | 584 | 224 | 209 | 170 | 216 | 193 | 211 | 105 | 233 | |||
| 2018 | 0 | 404 | 0 | 213 | 267 | 0 | 60 | 359 | ||||
| 2019 | 211 | 275 | 284 | 80 | 184 | 344 | 275 | 0 | 0 | 222 | 544 | |
| 2020 | 743 | 665 | 0 | 180 | 140 | 280 | 1 | 534 | ||||
| 2021 | 286 | 1,948 | 165 | 246 | 0 | 279 | 189 | 0 | 300 | 686 | ||
| 2022 | 175 | 193 | 778 | 275 | 99 | 187 | 297 | 975 | ||||
| 2023 | 833 | 305 | 833 | 275 | ||||||||
| 2024 | 275 | |||||||||||
| - = No Data Reported; -- = Not Applicable; NA = Not Available; W = Withheld to avoid disclosure of individual company data. |
| Release Date: 3/29/2024 |
| Next Release Date: 4/30/2024 |