|
Download Data (XLS File) |
|
||||||||
|
||||||||
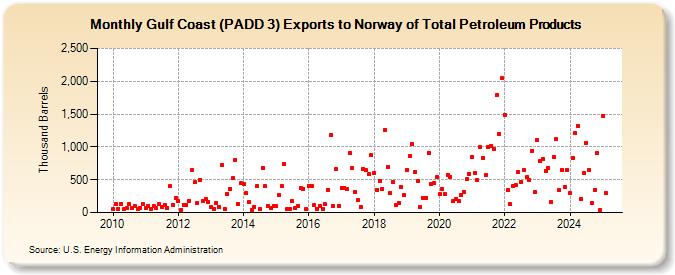
| Gulf Coast (PADD 3) Exports to Norway of Total Petroleum Products (Thousand Barrels) | ||||||||
| Year | Jan | Feb | Mar | Apr | May | Jun | Jul | Aug | Sep | Oct | Nov | Dec |
|---|---|---|---|---|---|---|---|---|---|---|---|---|
| 2010 | 52 | 124 | 60 | 132 | 55 | 69 | 127 | 66 | 96 | 54 | 71 | 129 |
| 2011 | 65 | 98 | 53 | 96 | 65 | 126 | 85 | 117 | 77 | 400 | 120 | 221 |
| 2012 | 171 | 44 | 117 | 116 | 179 | 652 | 458 | 153 | 502 | 183 | 210 | 167 |
| 2013 | 84 | 59 | 153 | 88 | 723 | 57 | 288 | 366 | 523 | 808 | 129 | 445 |
| 2014 | 440 | 294 | 154 | 45 | 92 | 402 | 52 | 683 | 400 | 102 | 64 | 99 |
| 2015 | 94 | 260 | 401 | 745 | 57 | 58 | 177 | 66 | 97 | 381 | 365 | 53 |
| 2016 | 406 | 412 | 111 | 59 | 98 | 58 | 124 | 348 | 1,181 | 99 | 665 | 97 |
| 2017 | 369 | 376 | 364 | 908 | 676 | 317 | 190 | 87 | 660 | 644 | 583 | 870 |
| 2018 | 610 | 346 | 487 | 361 | 1,258 | 690 | 299 | 463 | 112 | 145 | 389 | 269 |
| 2019 | 652 | 854 | 1,046 | 624 | 481 | 86 | 221 | 226 | 913 | 434 | 452 | 537 |
| 2020 | 277 | 361 | 282 | 579 | 538 | 171 | 206 | 174 | 273 | 319 | 504 | 593 |
| 2021 | 852 | 606 | 489 | 991 | 836 | 574 | 996 | 1,014 | 967 | 1,786 | 1,193 | 2,045 |
| 2022 | 1,491 | 336 | 123 | 397 | 413 | 614 | 467 | 652 | 534 | 495 | 944 | 309 |
| 2023 | 1,103 | 789 | 628 | 636 | 387 | 166 | 846 | 876 | 342 | 515 | 396 | 926 |
| 2024 | 295 | |||||||||||
| - = No Data Reported; -- = Not Applicable; NA = Not Available; W = Withheld to avoid disclosure of individual company data. |
| Release Date: 3/29/2024 |
| Next Release Date: 4/30/2024 |